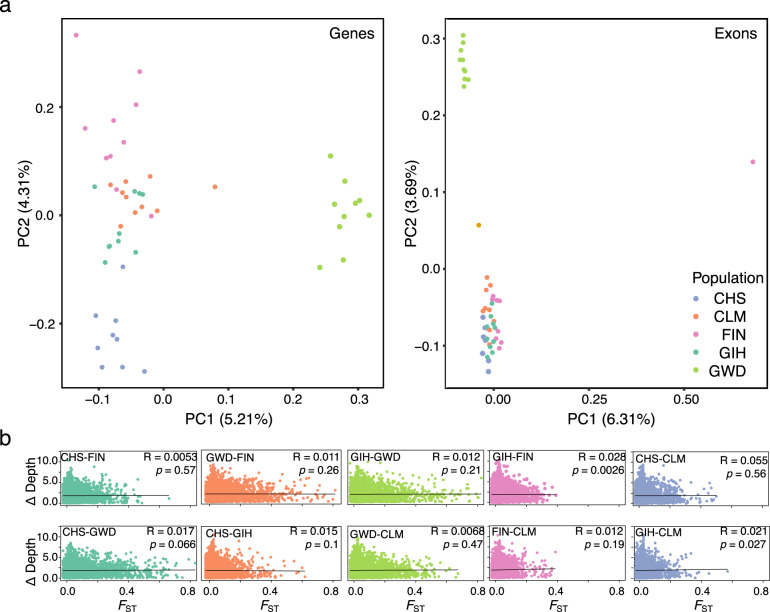
Fig. 2. Population structuring and the effect of population-specific genetic variation on read mapping coverage.
a PCA analysis of genetic variation in each simulated individual of the five tested populations across all NBS genes (left) and exonic regions of NBS genes (right) for 150 bp read lengths. b The difference in mapping depth for 1 kb stepping genomic windows across all NBS genes between two tested populations plotted against pairwise FST values for the same genomic windows and populations.

