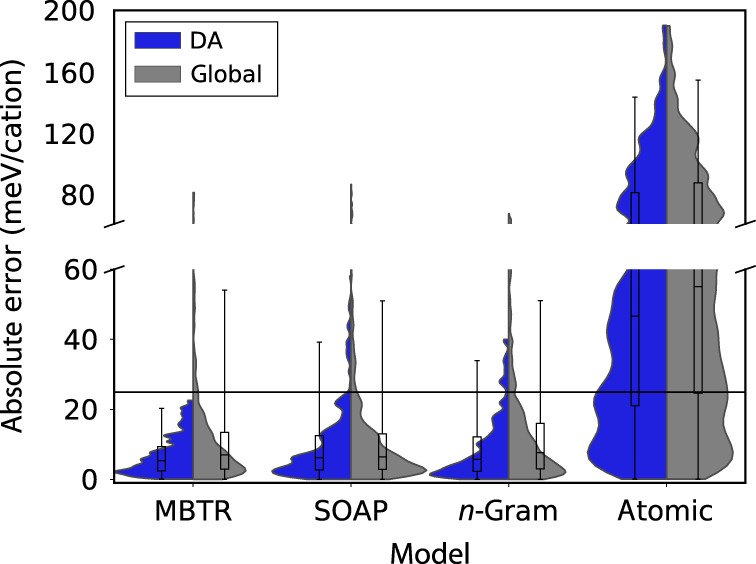
Fig. 3. DA versus global ML-model performance.

Comparison of absolute error distributions for entire test set (global/gray) and for DA validation sets (DA/blue) using violin plots that extend to the 98th percentile. Boxplots inside violin plots indicate 25th, 50th, and 75th percentiles (boxes) of the absolute errors, as well as 5th and 95th percentiles (whiskers). Horizontal line indicates reference error level of half of the mean energy difference between the minimum energy and the second-to-minimum energy polymorph (mean over all considered concentrations).
