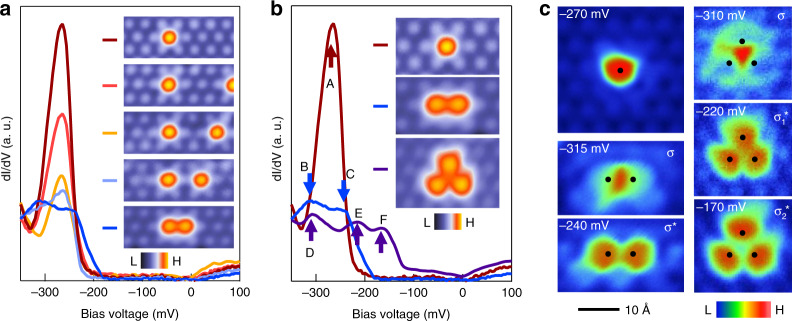
Fig. 3. Interacting impurity states induced quantized orbitals.
a Differential conductance spectra taken at the central impurity with perturbations of varying strengths from a second impurity. Inset: respective topographic images for impurity configurations. Note the images are acquired by finding different surface locations. b Local impurity state with coupling to different numbers of impurities. The arrows highlight the quantized splitting with additional interacting impurity numbers. Note the images are acquired by finding different surface locations. c dI/dV maps at the respective bound state energies in (b). dI/dV maps taken at V = −270 mV for a single impurity; −315 mV (bonding state σ) and −240 mV (antibonding state σ) for a double impurity, respectively; −310 mV (bonding state σ), −220 mV (antibonding state σ1*) and −170 mV (antibonding state σ2*) for a triple impurity, respectively. The black dots mark the center of impurities.

