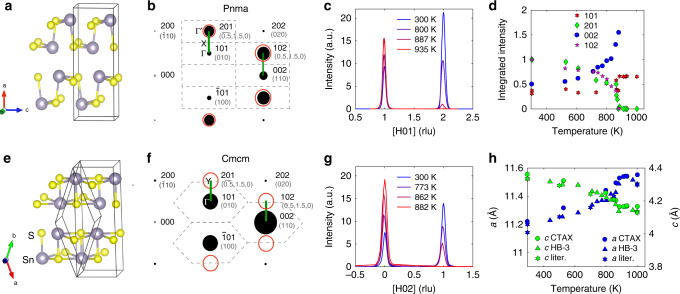
Fig. 1. Crystal structure and phase transition.
a, e Crystal structures for the Pnma and Cmcm phases of SnS. b, f Neutron-weighted reciprocal space maps for the Pnma (300 K)57 and Cmcm (1000 K)11 phases in the (H0L) plane (conventional Pnma cell). Bold Miller indices are in Pnma notation, while those enclosed in parentheses are in primitive Cmcm notation. Brillouin zones for the conventional Pnma and primitive Cmcm cells are indicated by the dashed gray outlines, together with X and Y points, in (b) and (f), respectively. Superstructure Bragg peaks disappearing in the Cmcm phase are circled in red. Green segments correspond to directions measured with TAS. Single-crystal diffraction data on SnS for [H01] from CTAX (c) and for [H02] from HB-3 (g). d Evolution of SnS integrated peak intensities (±0.25 H (rlu)) and h lattice parameters (literature data from ref. 11) with temperature. In e the rhombohedron shows the primitive cell, while the larger rectangular parallelepiped is the conventional cell. The coordinate system shown in (e) is for the primitive cell.

