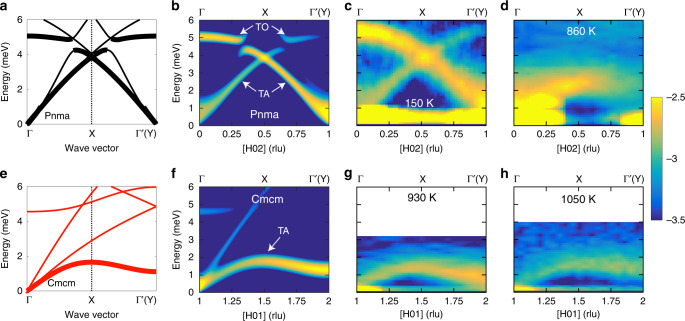
Fig. 2. Extended anharmonic collapse of phonon dispersions.
Evolution of SnS phonon dispersions and dynamical susceptibility (χ″(Q, E)) across the structural phase transition. Upper panels are for the Pnma phase whereas lower panels show the Cmcm phase. Low energy dispersions computed in the Pnma phase with the harmonic approximation (a) and the Cmcm phase with TDEP at 800 K (e), for wave-vectors along [100] (Pnma notation). Thicker lines indicate which dispersions are seen in the experimental data. The same reciprocal path is plotted in both panels, corresponding to Γ–Y in the Cmcm phase and Γ–X– in the Pnma phase, where is a superlattice zone center (Fig. 1). High symmetry points of the Pnma Brillioun zone (BZ) are shown without parentheses whereas those for the Cmcm BZ are shown in parentheses. b, f Show the corresponding computed χ″(Q, E) along [H02] and [H01] where Pnma notation for the Miller indices are used throughout. c, d, g, h Highlight the temperature evolution of χ″(Q, E) measured with INS along the same direction in the irreducible BZ as (b, f). As indicated in (b, f), these reciprocal-space paths highlight low-energy TAc and TOc phonons polarized along c in the Pnma phase (c, d) and Cmcm phase (g, h). The paths shown in (b–d) are not exactly equivalent to those shown in (f–h) but show the same direction in the irreducible BZ and have very similar polarization conditions such that all show c-polarized modes. Data were collected on CNCS (c), HB-3 (d) and CTAX (g, h). Intensity is plotted in a log10 scale on color maps.

