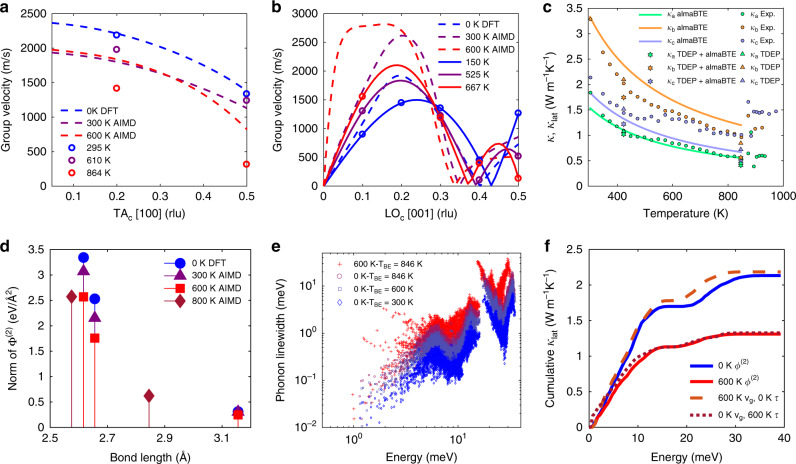
Fig. 4. Phonon renormalization and effect on thermal transport.
a Group velocities extracted from experiments and simulations (see “Methods” for details) for the TAc along [100] (measured with CTAX at Q = (1.5, 0, 1) and (1.8,0,1)) and b LOc along [001]. Open circles show Q corresponding to experimental measurements, solid lines are for vg from experiments and dashed lines for vg from simulations. c Measured κ (circles) and calculated κlat (lines and markers) along the a, b, and c crystallographic directions. Lines represent κlat computed with almaBTE and triangles are values from TDEP, while stars are from almaBTE, but with renormalized Φ(2) from TDEP. d Norm of Φ(2) from DFT (0 K) and TDEP (Pnma at 300, 600 K and Cmcm at 800 K). e Phonon linewidths calculated with Φ(2) from 0 K DFT (TBE = 300, 600 and 846 K) and 600 K TDEP (TBE = 846 K) with fixed Φ(3) (almaBTE). f Cumulative κlat (TBE = 300 K) from RTA with Φ(2) from 0 K DFT (vg,0K + τ0K) and 600 K TDEP (vg,600K + τ600K), as well as mixed group velocities and lifetimes (vg,600K + τ0K, and vg,0K + τ600K).

