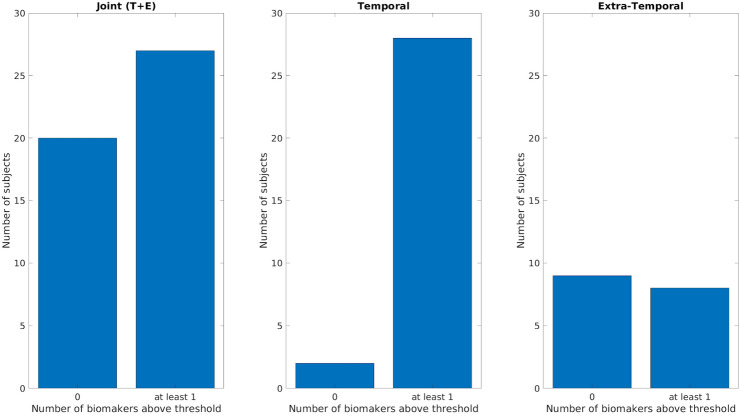
Figure 9.
Comparison of the ‘cumulative’ biomarker for the three different groups (Joint Temporal and Extra-Temporal, only Temporal, only Extra-Temporal) using a common average montage. Y-axis counts the number of patients considering the pre-resection recording of resected channels for which none (failed detection, labeled as 0 on x-axis) or at-least one biomarker (detection, labeled as at least 1) is above its respective threshold. T Temporal, E extra-temporal.

