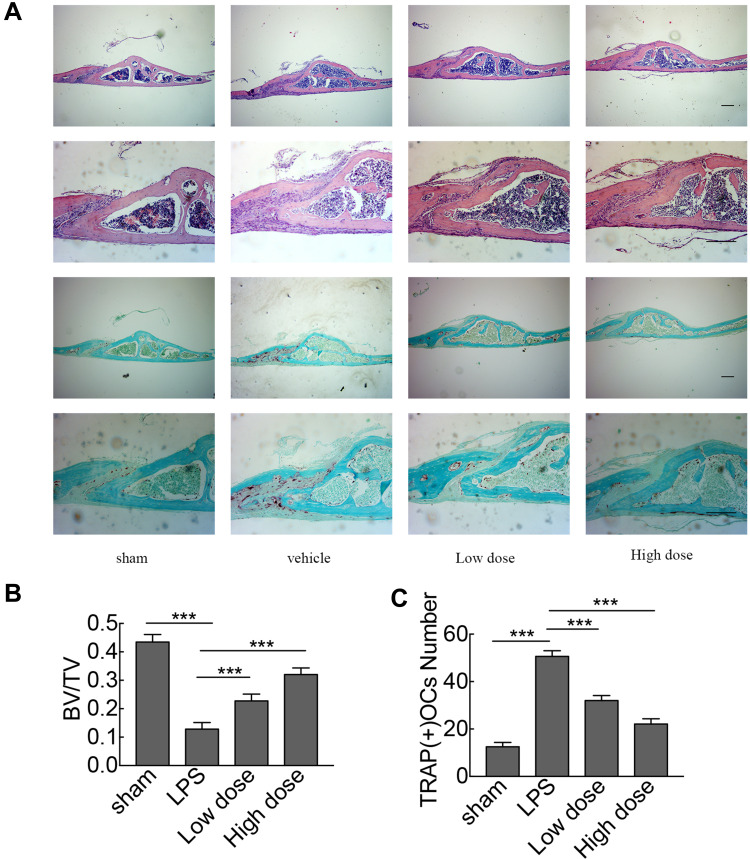
Figure 5.
Histological and histomorphometric analyses of the effect of sarsasapogenin on LPS-induced bone loss in vivo. (A) Representative images of calvaria stained with H&E and TRAP from the sham group (PBS; control), LPS (5 mg LPS/kg body weight), low-dose sarsasapogenin (5 mg LPS/kg and 5 mg sarsasapogenin/kg), and high-dose sarsasapogenin group (5 mg LPS/kg and 10 mg sarsasapogenin/kg) (n = 6) (scale bar = 200μm). (B and C) Quantification of BV/TV and TRAP (+) cell number (n = 6). Data represent the mean ± SD; ***p < 0.001 versus respective controls.

