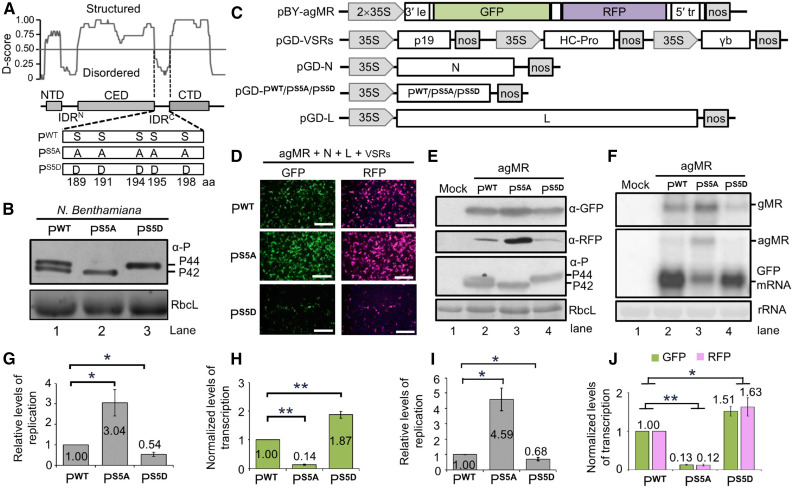
Figure 2.
Effects of P Phosphorylation on Minigenome Transcription and Replication.
(A) Modular organization of the BYSMV P protein and schematic representation of its phosphorylation mutants. Normalized scores for disorder (D-score) were calculated from 15 different predictors as described in Methods. Structured regions and disordered regions are indicated by gray boxes and lines, respectively. Five Ser residues (amino acids 189, 191, 194, 195, and 198) in the SR motif of PWT were mutated to either Ala (PS5A) or to Asp (PS5D).
(B) Immunoblot analyses of PWT, PS5A, and PS5D levels in infiltrated leaves.
(C) Illustration of the binary vectors used for generating antigenomic-sense minireplicon RNA (pBY-agMR) and pGD constructs for expression of the BYSMV N, P/PS5A/PS5D, and L proteins in Agrobacterium-infiltrated N. benthamiana leaves. The pGD-VSRs plasmid contains three expression cassettes for simultaneous expression of the viral suppressors of RNA silencing TBSV p19, TEV HC-Pro, and BSMV γb.
(D) GFP and RFP foci in N. benthamiana leaves at 5 dpi with Agrobacterium cultures containing pBY-agMR, pGD-N, pGD-L, pGD-VSRs, and pGD-P/PS5A/PS5D. GFP and RFP was photographed with a fluorescence microscope. Bar = 1 mm.
(E) Immunoblot analysis showing GFP, RFP, and P expression in Agrobacterium-infiltrated leaves of (D) with anti-GFP (α-GFP), anti-RFP (α-RFP), and anti-P (α-P) polyclonal antibodies. Mock buffer-infiltrated leaves were used as negative controls.
(F) RNA gel blot analysis of MR replication and transcription supported by PWT, PS5A, or PS5D proteins in Agrobacterium-infiltrated leaves. rRNAs were used as loading controls.
(G) Relative levels of minigenome RNA replication calculated from signal intensities of gMR bands of (F).
(H) Normalized levels of GFP mRNA transcription supported by the agMR plasmid in combination with the PWT, PS5A, or PS5D proteins. Note: Normalized levels of transcription refer to the ratio between GFP mRNA accumulation and gMR accumulation.
(I) Quantification by qPCR of the relative levels of minigenome replication supported by the PWT, PS5A, or PS5D proteins.
(J) GFP and RFP mRNA in the same agMR samples of (I) were analyzed by qPCR.
Note: All the results in (G) to (J) were obtained from three biologically independent experiments. The values in PWT samples were set to 1. The EF-1A gene served as internal control in (I) and (J). Error bars indicate sd. Data points above columns are mean values of three independent experiments. Statistically significant differences were determined by Student’s t test. *P-value < 0.05; **P- < 0.01.

