Figure 8.
Overexpression of CK1 Suppresses BYSMV Infections in Plants.
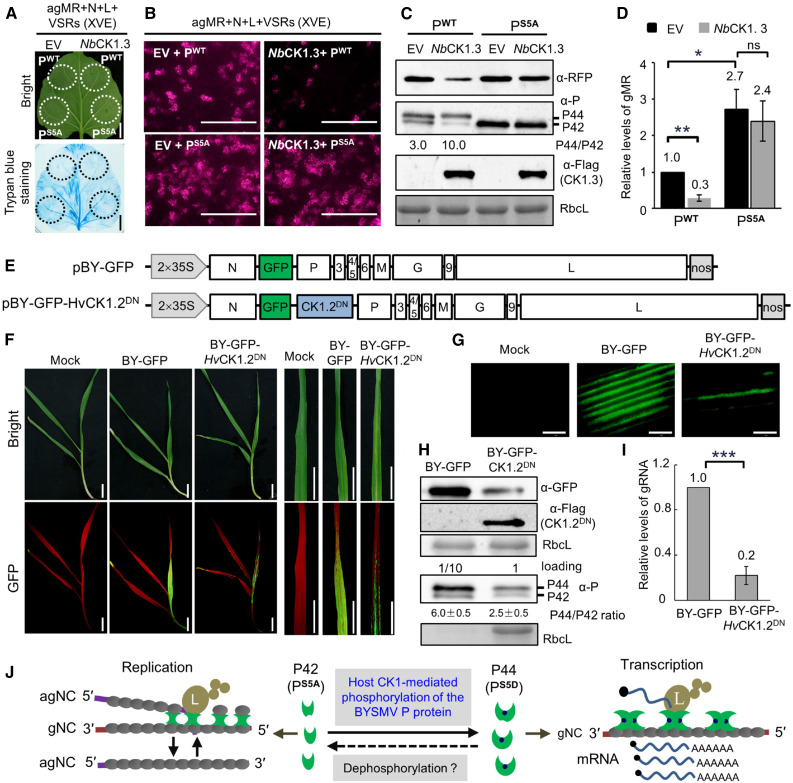
(A) Trypan blue staining of N. benthamiana leaves at 5 dpi after infiltration with Agrobacterium cultures containing pBY-agMR, pGD-N, pGD-L, pGD-VSRs, and pGD-PWT (wild type)/PS5A (phosphorylation defective mutant) with empty vector (EV) or NbCK1.3 under the control of the estradiol-inducible promoter. Estradiol (2 μM) was infiltrated at 3 dpi, and the leaves were stained at 5 dpi. Bar = 2 cm.
(B) RFP foci in N. benthamiana leaves from (A) at 5 dpi. Bar = 1 mm.
(C) Immunoblot analysis showing accumulation of the RFP, P, and NbCK1.3 proteins in the samples of (B). RbcL served as a loading control.
(D) RT-qPCR analysis showing accumulation of gMR in the samples shown in (B).
(E) Illustration of the genome organization of the pBY-GFP and pBY-GFP-HvCK1.2DN binary vectors harbored by the Agrobacterium cultures.
(F) Disease symptoms and GFP fluorescence of barley plants infected with BY-GFP and BY-GFP-HvCK1.2DN at 15 dpi. Bar = 2 cm.
(G) GFP foci in barley leaves of (F) observed by confocal microscope. Bar = 1 mm.
(H) Immunoblot analysis showing accumulation of the GFP and HvCK1.2DN proteins in the samples of (F). For detection of the BYSMV P protein, the total protein samples of BY-GFP were diluted 10 times for immunoblot analysis. RbcL served as a loading control.
(I) RT-qPCR analysis showing accumulation of BYSMV gRNA in the samples shown in (F).
(J) Proposed model for host CK1-mediated phosphorylation of the BYSMV P SR motif regulating virus transcription and replication. The BYSMV P proteins exist as a basally phosphorylated form (P42) and a hyper-phosphorylated form (P44). Viral replication and transcription of the N protein–encapsidated gRNA is accomplished by the polymerase L, P protein, and N proteins. The P protein dimer provides a physical link to attach the L protein to the N–RNA complex. Plant and insect CK1 proteins can phosphorylate the BYSMV P42 form to produce p44, which promotes the switch from replication to transcription.
In (D) and (I), error bars indicate sd. Data points are mean value of three independent experiments. Statistically significant differences were determined by the Student’s t test. *P < 0.05; **P < 0.01; ***P < 0.001.

