Figure 5.

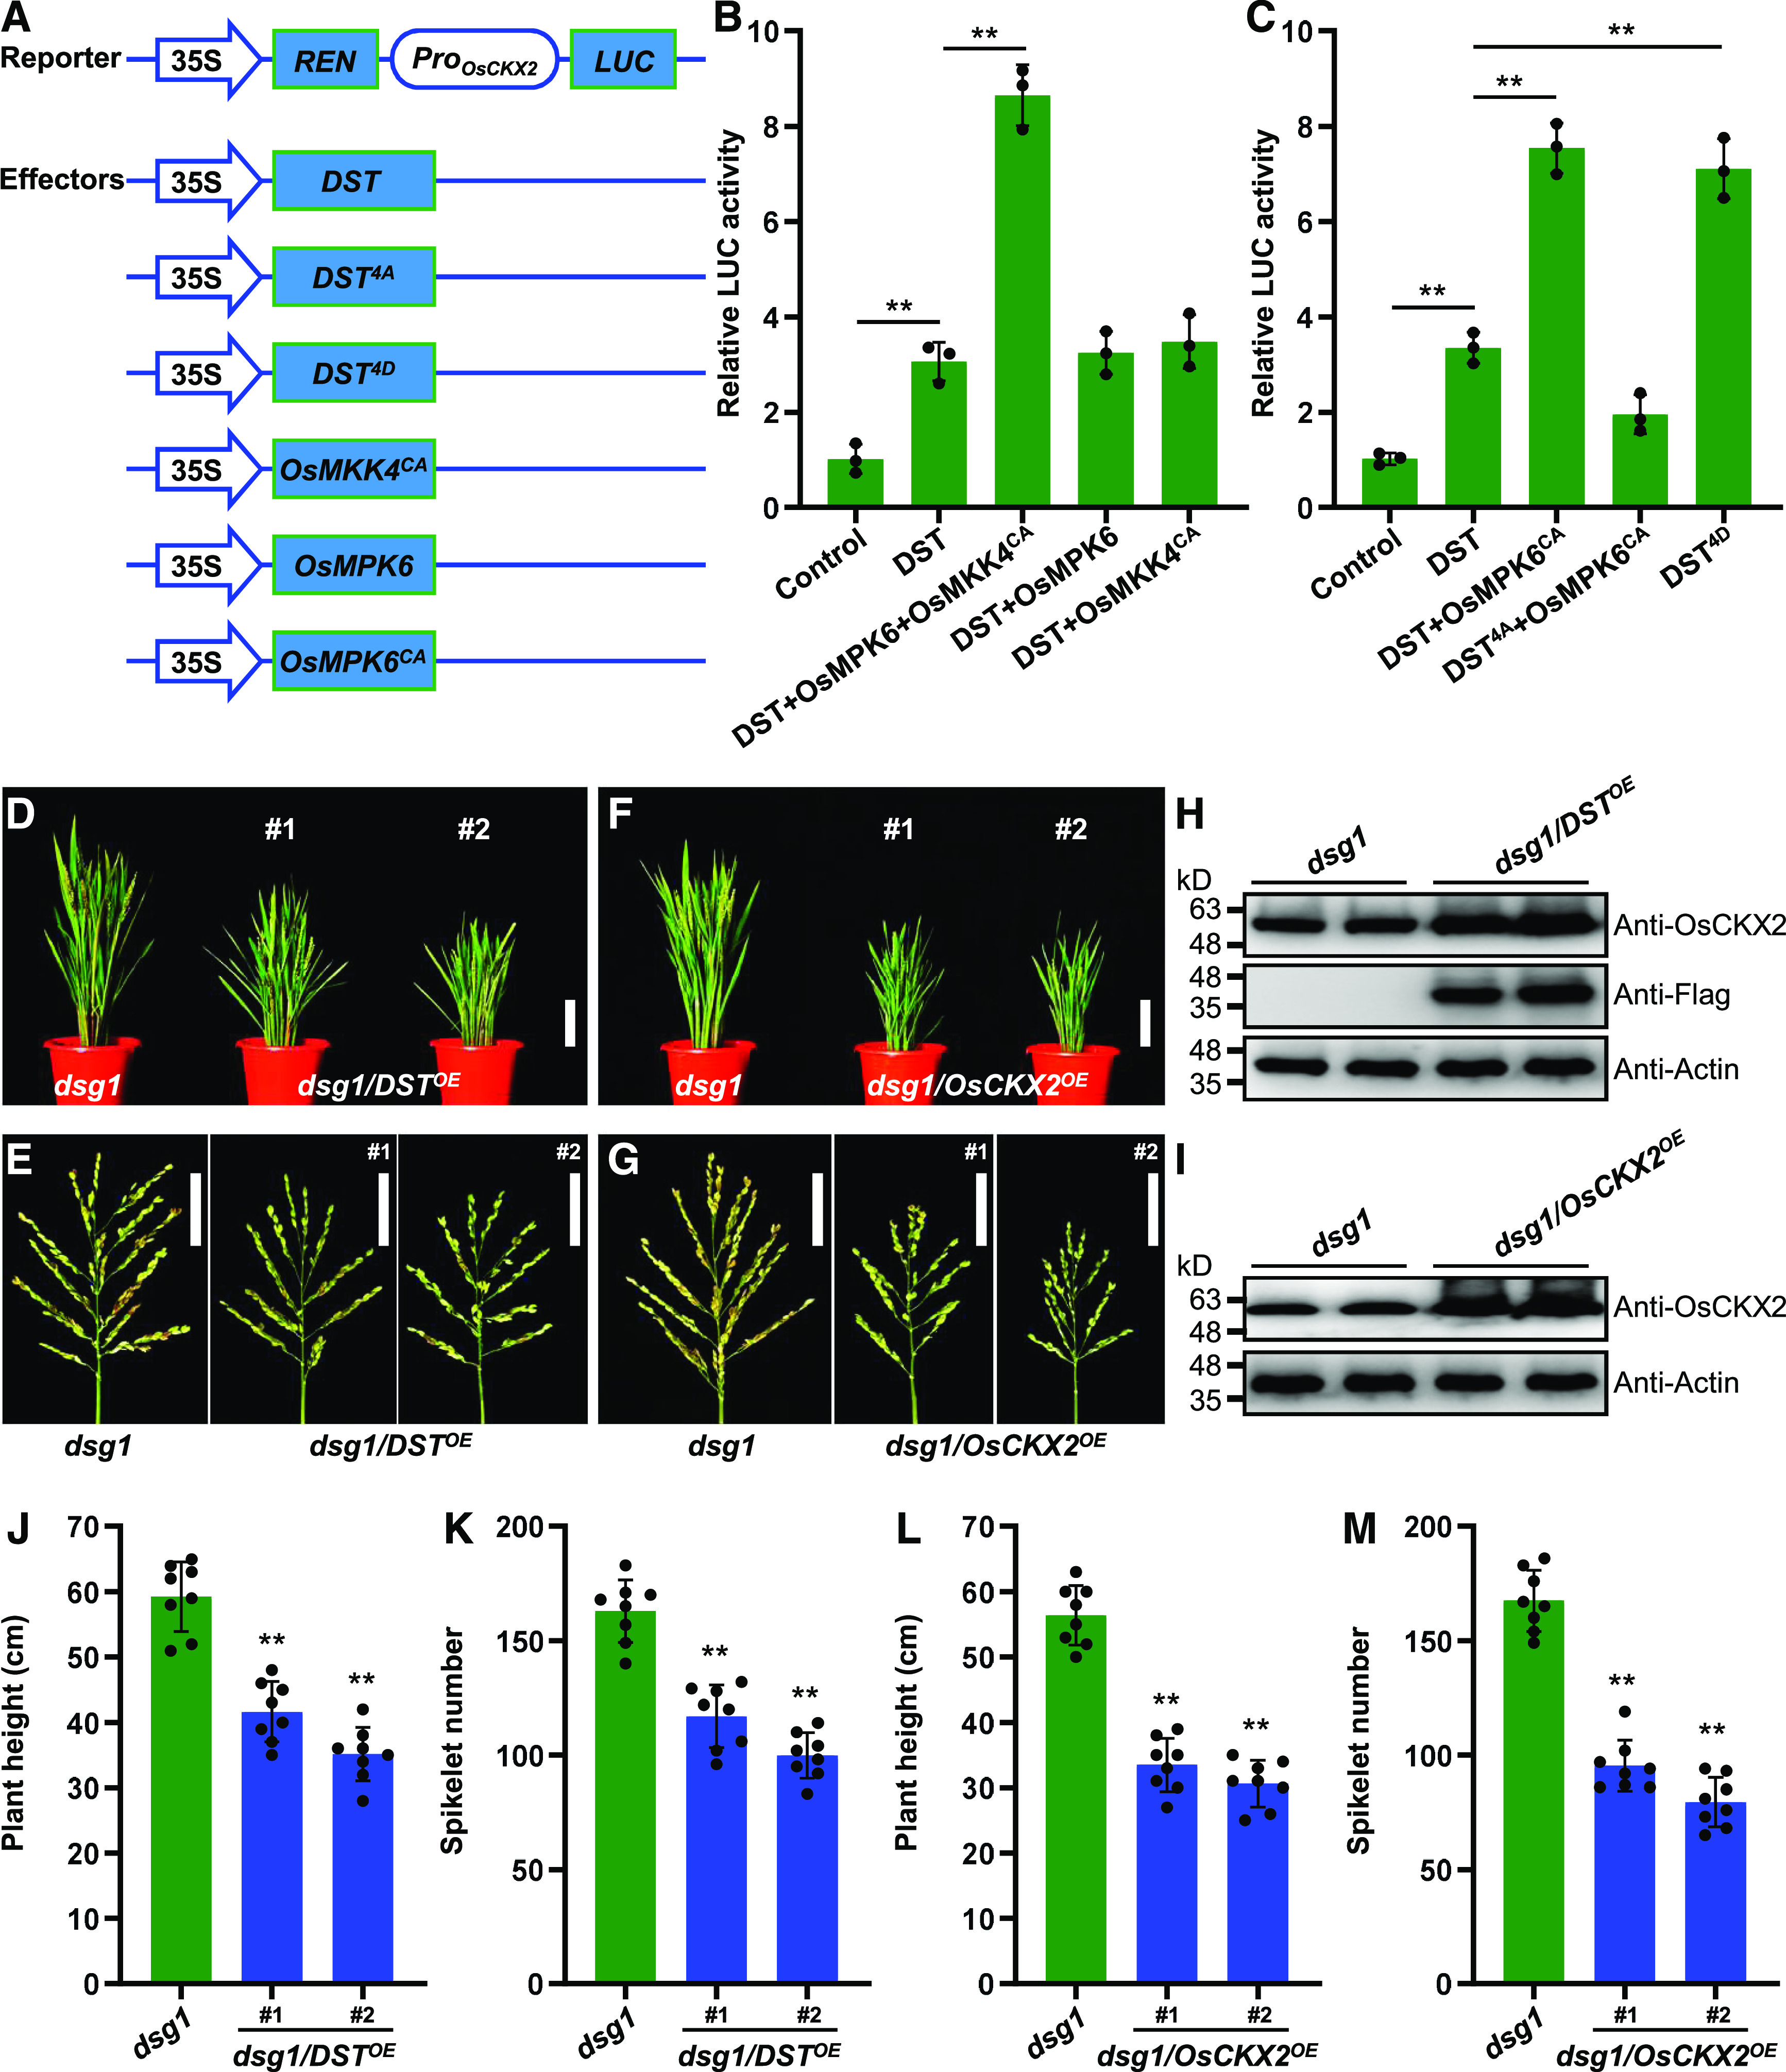
OsMPK6-Mediated Phosphorylation of DST Enhances Its Transcriptional Activity and Positively Regulates OsCKX2 Expression.
(A) Schematic diagram of the reporter and effector constructs used in the dual-LUC assay system.
(B) and (C) Transcriptional activation of OsCKX2 is enhanced by OsMKK4-OsMPK6 cascade-mediated DST phosphorylation (B), and constitutively activated DST (DST4D) (C) in rice protoplasts. Protoplasts were co-transformed with the reporter and different effector constructs and kept in the dark for 16 h. LUC/REN activity is shown (n = 3 independent biological repeats). Values are given as the mean ± sd. **P < 0.01 compared with the control using Student’s t test.
(D) Plant architecture of dsg1 mutant and dsg1 plants overexpressing DST (dsg1/DSTOE) at the reproductive stage. Scale bar, 10 cm.
(E) Panicle architecture of dsg1 mutant and dsg1/DSTOE plants at the reproductive stage. Scale bar, 5 cm.
(F) Plant architecture of dsg1 mutant and dsg1 plants overexpressing OsCKX2 (dsg1/OsCKX2OE) at the reproductive stage. Scale bar, 10 cm.
(G) Panicle architecture of dsg1 mutant and dsg1/OsCKX2OE plants at the reproductive stage. Scale bar, 5 cm.
(H) and (I) DST protein levels in the young panicles of dsg1/DSTOE (H), and OsCKX2 protein levels in the young panicles of dsg1/OsCKX2OE (I). Proteins extracted from pooled 0.1-0.5 cm panicles were subjected to immunoblot analysis using anti-Flag and anti-OsCKX2 antibodies. The anti-Actin antibody was used as the loading control.
(J) Comparison of average plant height between dsg1 and the dsg1/DSTOE transgenic lines (n = 8 plants).
(K) Comparison of average spikelet number per panicle between dsg1 and the dsg1/DSTOE lines (n = 8 plants).
(L) Comparison of average plant height between dsg1 and the dsg1/OsCKX2OE transgenic lines (n = 8 plants).
(M) Comparison of average spikelet number per panicle between dsg1 and the dsg1/OsCKX2OE lines (n = 8 plants). Values are given as the mean ± sd. **P < 0.01 compared with the control using Student’s t test.
