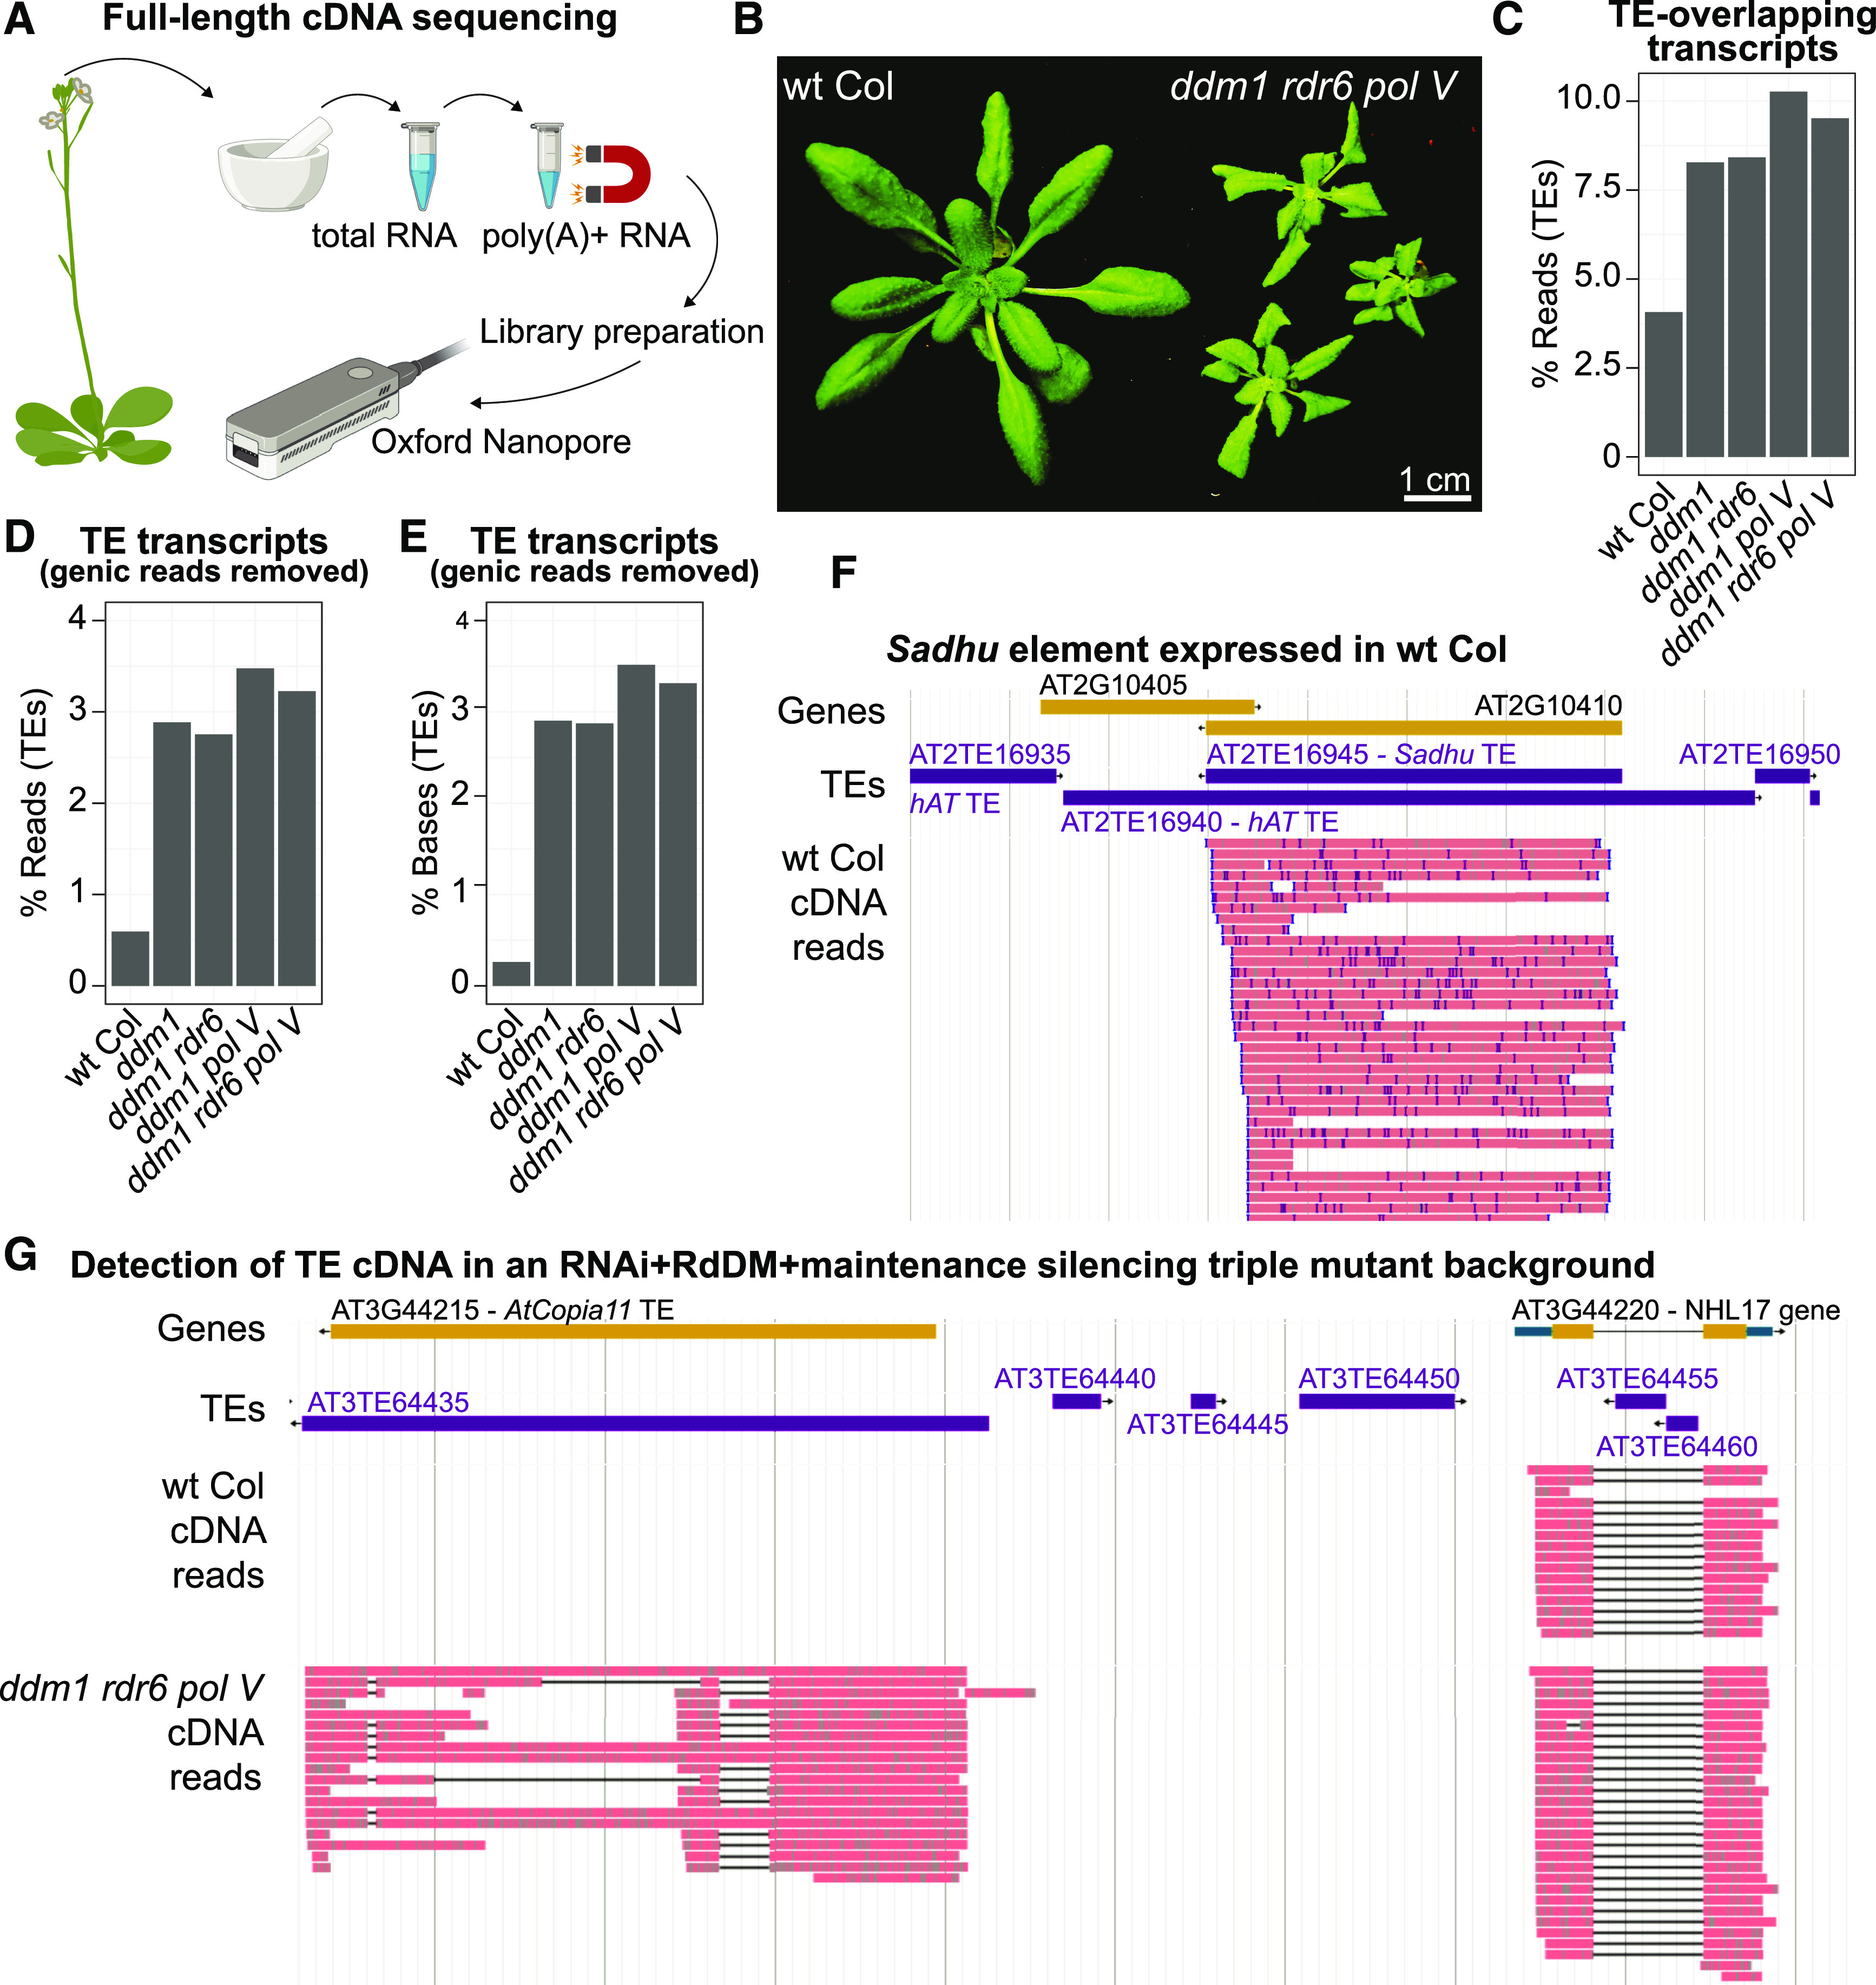
Figure 1.

TE Expression Captured by Long-Read cDNA Sequencing.
(A) Experimental workflow of ONT cDNA sequencing. See Methods for additional experimental details. The cartoon was created with BioRender.
(B) Phenotype of the ddm1 rdr6 pol V mutant line.
(C) Percentage of reads that overlap a TE annotation in each genotype.
(D) Percentage of reads that overlap a TE annotation, but with genic transcripts that read-through a TE removed to focus on TE-initiated transcripts.
(E) Percentage of TE bases covered by reads, with genic transcripts that read-through TEs removed.
(F) Genome browser image of the expression of the Sadhu TE AT2TE16945 in wild-type (wt) Col.
(G) Genome browser image of the representative AT3TE64435 AtCopia11 TE (left), which is only expressed in TE-activated mutants, compared with a gene expressed in both genotypes (right).
In (F) and (G), genic exons are yellow, untranslated regions are blue, TEs are purple, and ONT cDNA reads are pink. Gene and TE annotations are from TAIR10.
