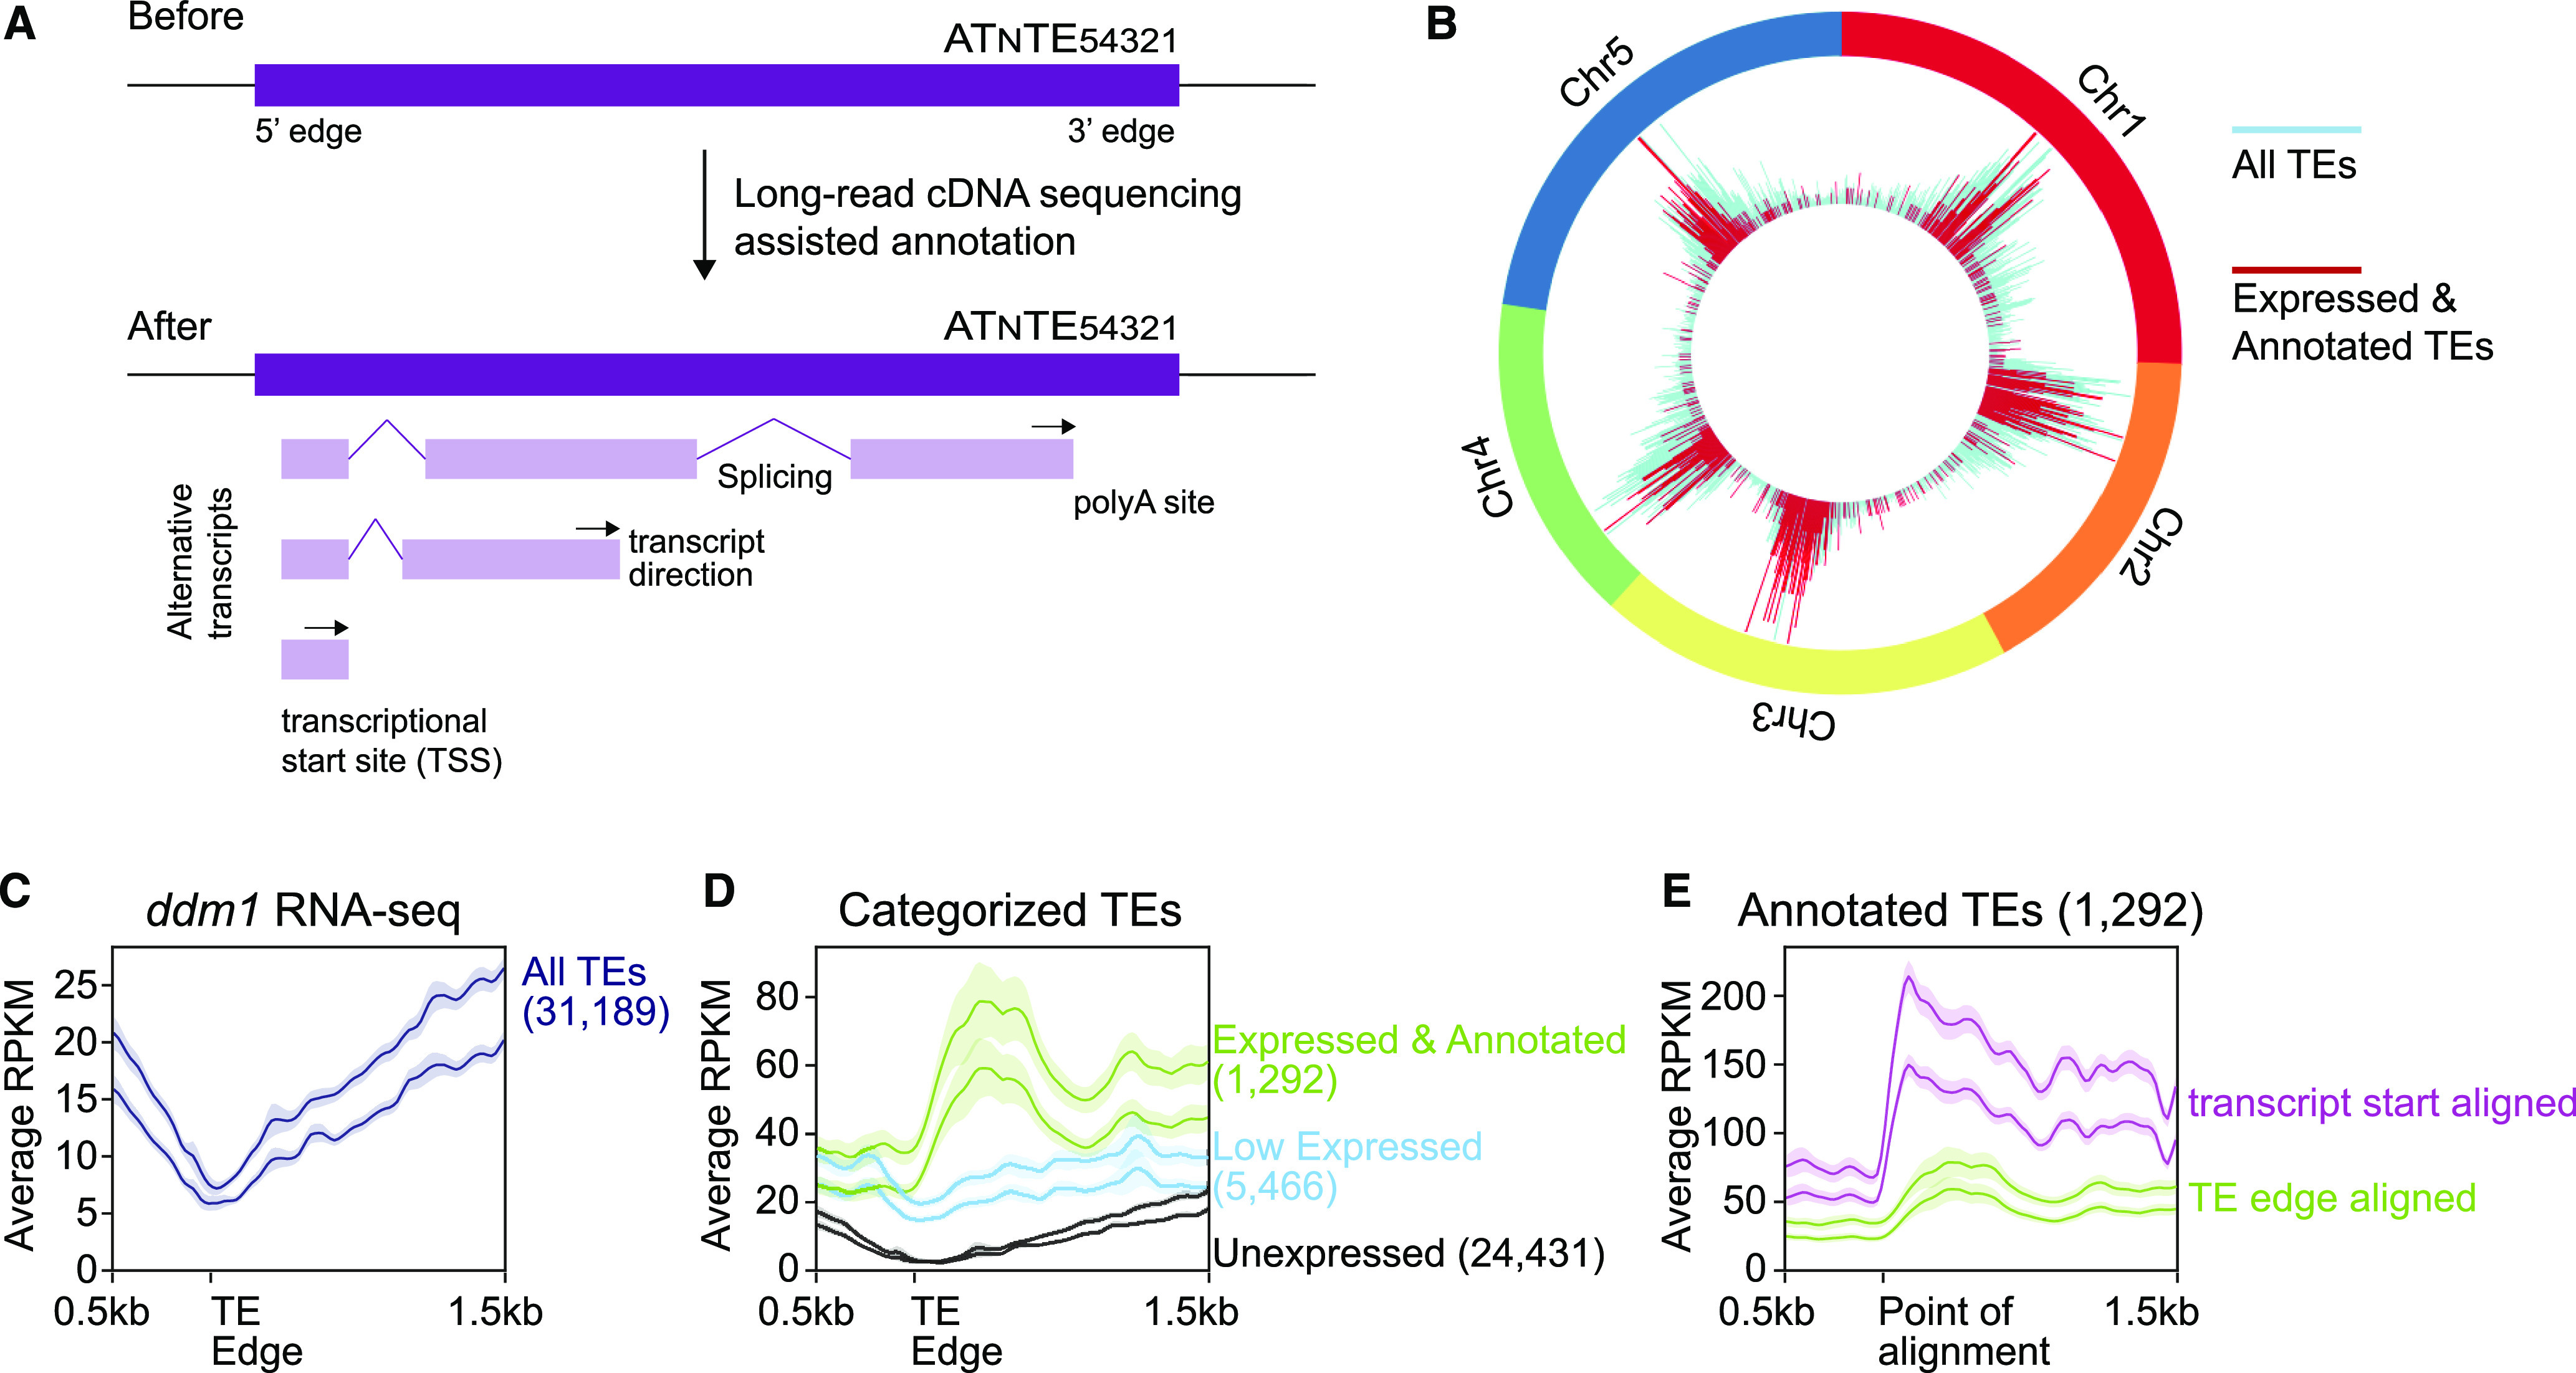
Figure 2.

Genome-Wide Annotation of TE Transcripts.
(A) Cartoon of TE annotated features before and after this work.
(B) Visualization of the chromosomal location of the TEs that are expressed and have been annotated in this work.
(C) Metaplot alignment of Illumina RNA-seq reads from ddm1 to 5′ edges for all TEs. The y axis represents the average reads per kilobase per million mapped reads (RPKM).
(D) The same as in (C), but the TEs are divided into expression categories based on our ONT cDNA sequencing. Low expressed TEs did not produce enough reads for transcript annotation.
(E) The same as in (D), but the Expressed and Annotated TE class is shown twice, once aligned by the TE edge (green line, same as in [D]) and once aligned by the now annotated TE TSS (purple line).
In (C) to (E), the two lines in each group represent distinct biological replicates (pools of nonoverlapping plants), the solid line indicates the moving average with a bin size of 20 bases, and the translucent region is the 95% confidence interval. The 5′ edges of the TEs are defined by the TAIR10 TE annotation. Numbers in parentheses denote the number of TEs analyzed in each category.
