Figure 1.
The pkn2 Mutation Partially Rescues the ccs52a2-1 Phenotypes.
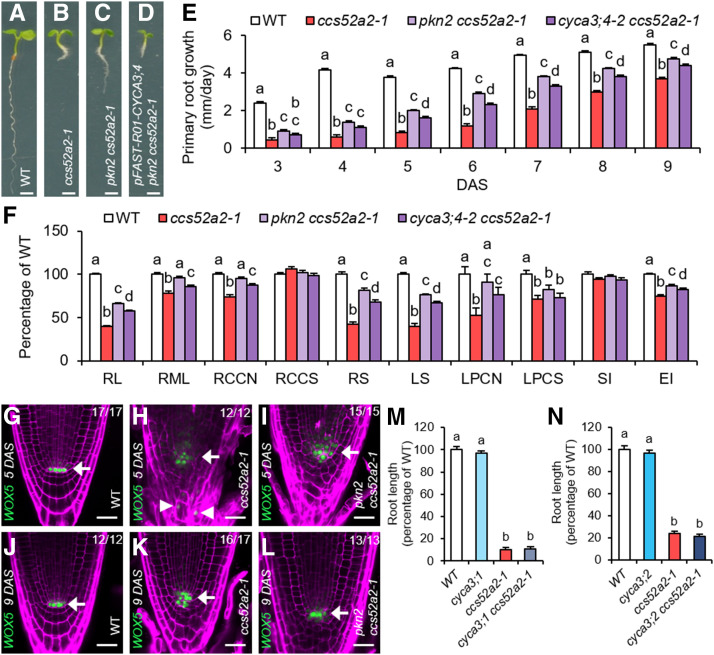
(A) to (D) Representative seedlings of the wild type (WT) (A), ccs52a2-1 (B), and pkn2 ccs52a2-1 without (C) and with (D) the pFAST-R01-CYCA3;4 complementation construct at 5 DAS. Scale bars represent 1 mm.
(E) and (F) Growth characteristics of the wild type (WT), ccs52a2-1, and the double mutants pkn2 ccs52a2-1 and cyca3;4-2 ccs52a2-1. (E) Primary root growth from 3 to 9 DAS (n ≥ 62). (F) Phenotypes of the primary root at 9 DAS and the shoot and the first leaf pair at 21 DAS. RL, Root length (n ≥ 62); RML, root meristem length (n ≥ 25); RCCN, root cortical cell number (n ≥ 25); RCCS, root cortical cell size (n ≥ 25); RS, rosette size (n ≥ 56); LS, leaf size (n ≥ 31); LPCN, leaf pavement cell number (n = 15); LPCS, leaf pavement cell size (n = 15); SI, stomatal index (n = 15); EI, endoreplication index (n ≥ 15). Bars represent estimated marginal means, and error bars represent se. Letters on the bars indicate statistically different means (P < 0.05, ANOVA mixed model analysis, Tukey correction for multiple testing). See also Supplemental Data Set 4.
(G) to (L) Representative confocal images of WOX5pro:GFP-GUS expressed in the wild type ([G] and [J]), ccs52a2-1 ([H] and [K]), and pkn2 ccs52a2-1 ([I] and [L]) primary roots at 5 ([G] to [I]) and 9 ([J] to [L]) DAS. The GFP signal is shown in green, while cell walls are visualized through PI staining (magenta). Arrows indicate the position of the quiescent center (QC), while ectopic WOX5 expression in ccs52a2-1 is indicated by arrowheads. Scale bars represent 25 µm. The number of roots imaged for each line and time point are shown in each image.
(M) and (N) Root length at 9 DAS of the wild type (WT), cyca3;1, ccs52a2-1, and cyca3;1 ccs52a2-1 (n ≥ 12) (M) or of WT, cyca3;2, ccs52a2-1, and cyca3;2 ccs52a2-1 (n ≥ 9) (N). Plants were genotyped and measured in segregating F2 populations. Bars represent the mean, and error bars represent se. Letters on the bars indicate statistically different means (P < 0.05, ANOVA, Tukey correction for multiple testing). See also Supplemental Data Set 4.

