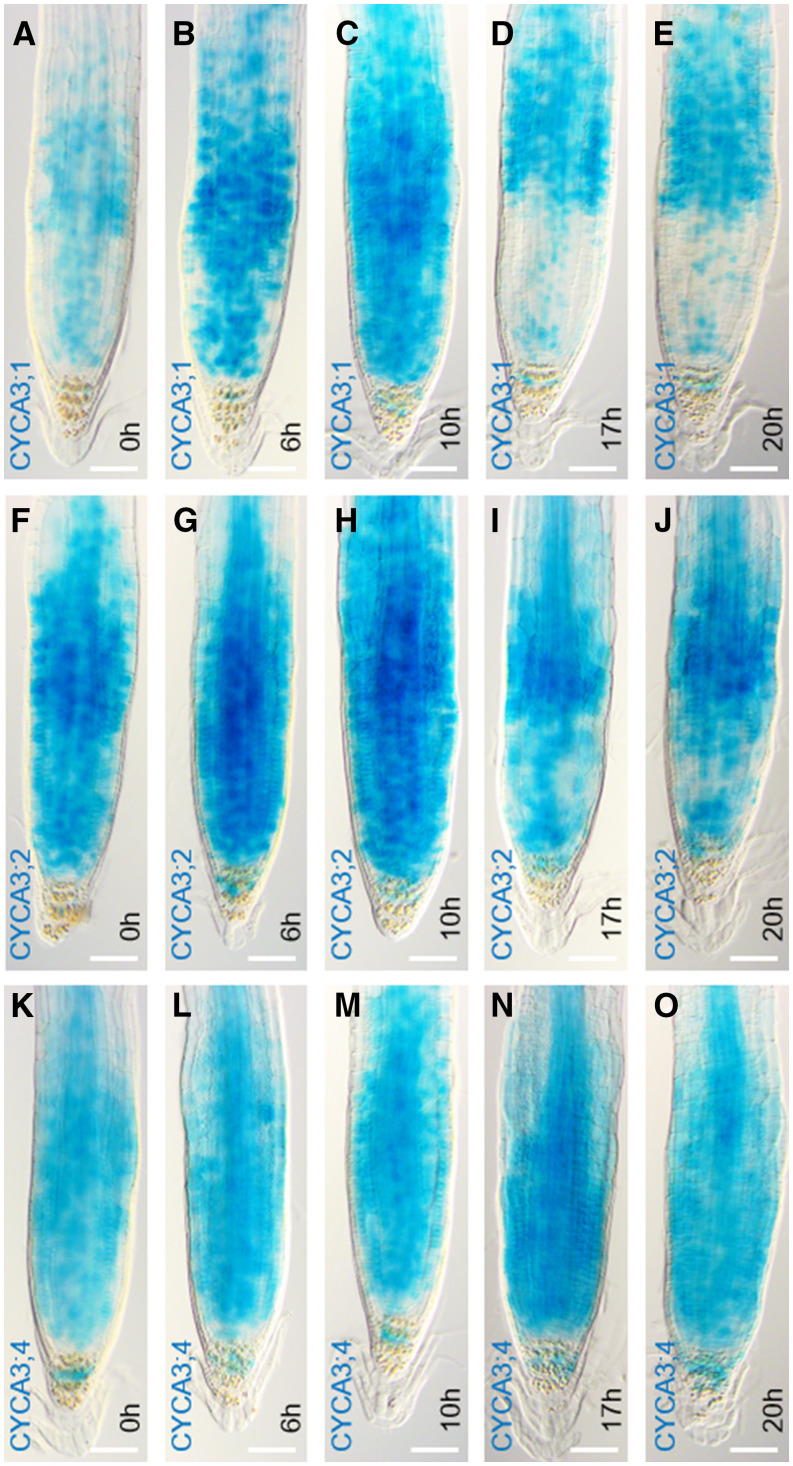
Figure 5.
Accumulation of CYCA3 Proteins throughout the Cell Cycle.
(A) to (O) GUS signal at 7 DAS in root tips of CYCA3;1pro:CYCA3;1-GUS ([A] to [E]), CYCA3;2pro:CYCA3;2-GUS ([F] to [J]), and CYCA3;4pro:CYCA3;4-GUS ([K] to [O]) synchronized by treating with 2 mM hydroxyurea for the indicated periods. The 0-h time point represents untreated control conditions ([A], [F], and [K]), while 6 h corresponds with S phase ([B], [G], and [L]), 10 h with G2 ([C], [H], and [M]), 17 h with G2/M ([D], [I], and [N]), and 20 h with M/G1 ([E], [J], and [O]). Per line and time point, six images were taken. Scale bars represent 50 µm.

