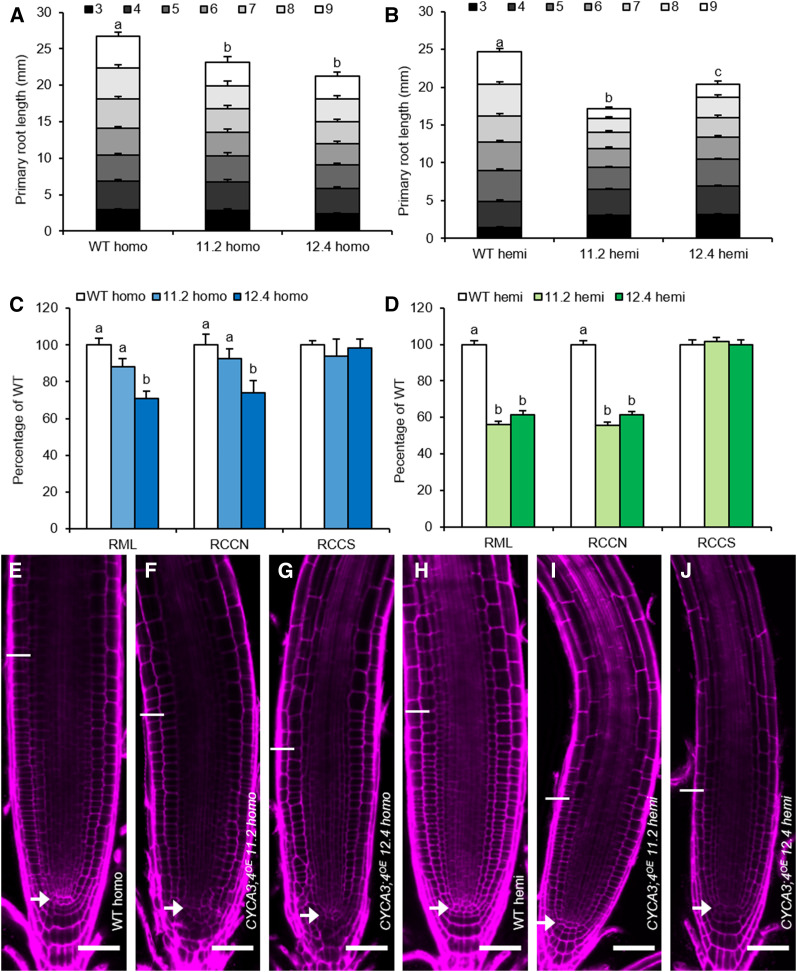
Figure 7.
The Effects of CYCA3;4 Overexpression in the Root.
(A) and (B) Primary root length from 3 to 9 DAS of homozygous ([A], n ≥ 14) and hemizygous ([B], n ≥ 33) CYCA3;4OE lines 11.2 and 12.4. The bar heights were subdivided according to the measured daily growth. Bars represent estimated marginal means, error bars represent se (n ≥ 23), and letters indicate statistically different means for each genotype, as calculated for the total root length at 9 DAS (P < 0.05, ANOVA mixed model analysis, Tukey correction for multiple testing). See also Supplemental Data Set 4. WT, wild type.
(C) and (D) Root meristem characteristics at 9 DAS of homozygous ([C], n ≥ 12) and hemizygous ([D], n ≥ 22) CYCA3;4OE lines 11.2 and 12.4. Bars represent estimated marginal means; error bars represent se. Letters indicate statistically different means (P < 0.05, ANOVA mixed model analysis, Tukey correction for multiple testing). See also Supplemental Data Set 4. RML, Root meristem length; RCCN, root cortical cell number; RCCS, root cortical cell size; WT, wild type.
(E) to (J) Representative confocal images of the root meristem of homozygous ([E] to [G]) or hemizygous ([H] to [J]) wild type (WT; [E] to [H]) and CYCA3;4OE lines 11.2 ([F] to [I]) and 12.4 ([G] to [J]). Cell walls were visualized by PI staining. Arrows indicate the position of the QC, while the end of the meristem is indicated by a line. Scale bars represent 50 µm.

