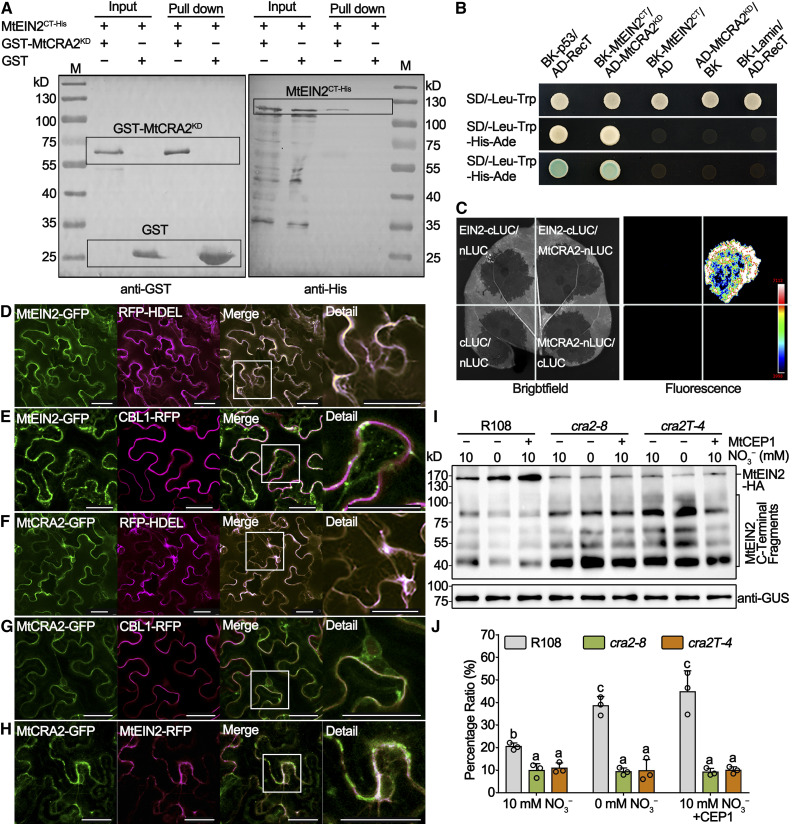
Figure 7.
MtCRA2 Interacts with MtEIN2 and Inhibits Its Cleavage.
(A) GST pull-down assay of GST-MtCRA2KD and MtEIN2CT-His fusion proteins coexpressed in BL21 E. coli cells. An immunoblot analysis with anti-GST (left image) and anti-His antibodies (right image) allowed the identification of input and pull-down proteins, respectively. Proteins corresponding to the bands observed are indicated with the rectangular boxes.
(B) Yeast two-hybrid assay of the MtCRA2KD and MtEIN2CT protein interaction in AH109 cells grown on SD/-Leu/-Trp (top) and SD/-Ade/-His/-Leu/-Trp (middle and bottom) media. pGBKT7-p53/pGADT7-RecT and pGBKT7/pGADT7 vectors were used as positive and negative controls, respectively.
(C) Firefly luciferase complementation imaging assay of the interaction between full-length MtCRA2 and MtEIN2 proteins in N. benthamiana leaves. Luciferase fluorescence was detected using a CCD camera.
(D) to (H) Subcellular localization of MtCRA2 and MtEIN2. For the localization of MtEIN2 and MtCRA2, N. benthamiana leaves were cotransformed with Pro35S:MtEIN2-GFP and the Pro35S:RFP-HDEL fusion used as an ER marker (D) or Pro35S:CBL1-RFP fusion used as a PM marker (E), Pro35S:MtCRA2-GFP and Pro35S:RFP-HDEL (F), or Pro35S:CBL1-RFP (G). For the MtCRA2 and MtEIN2 colocalization, N. benthamiana leaves were cotransformed with Pro35S:MtCRA2-GFP and Pro35S:MtEIN2-RFP constructs (H). Similar observations were made in more than three random views and in another independent repeat. The GFP and RFP signals were detected with a Leica SP8 confocal microscope. Bars = 40 μm.
(I) The cleavage of MtEIN2 was measured by immunoblot analysis in the transgenic roots of R108, cra2-8, and cra2T-4 transformed with a Pro35S:MtEIN2-HA construct and treated with 0 mM N or 1 μM MtCEP1 peptides for 24 h. The full-length MtEIN2-HA protein (146 kD) and C-terminal fragments of MtEIN2 (40 to 100 kD) are indicated. The Pro35S:MtEIN2-HA construct also contains a Pro35S:GUS fusion, and GUS was used as a loading control.
(J) The quantification of the intensity of immunoblot bands, as analyzed using ImageJ software. The values show the percentages of the full-length MtEIN2 protein pool relative to the total of the MtEIN2 protein pool. The data are means ± sd of three independent experiments based on three independent pools of roots, and significant differences were determined with an ANOVA with a posthoc Duncan’s test, as indicated by letters (P < 0.05; Supplemental Data Set 3).

