
Figure 5.
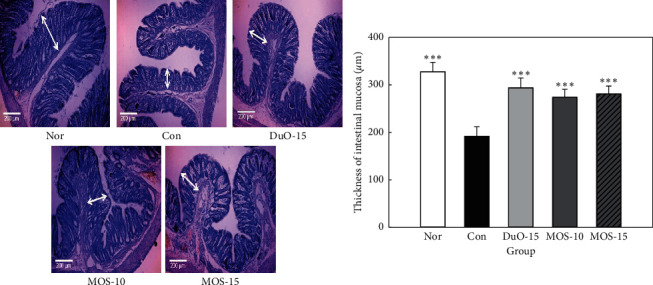
Effect of maltooligosaccharide (MOS) on thickness of intestinal mucosa. Nor: normal group, Con: control group, DuO-15: Du-oligo 15%-treated group as positive control, MOS-10: MOS 10%-treated group, and MOS-15: MOS 15%-treated group. The other groups except Nor are loperamide-induced constipation models. Data are represented as the mean ± SE. ∗∗∗P < 0.001 versus control group (ANOVA followed by post hoc Tukey's test).