
Figure 10.
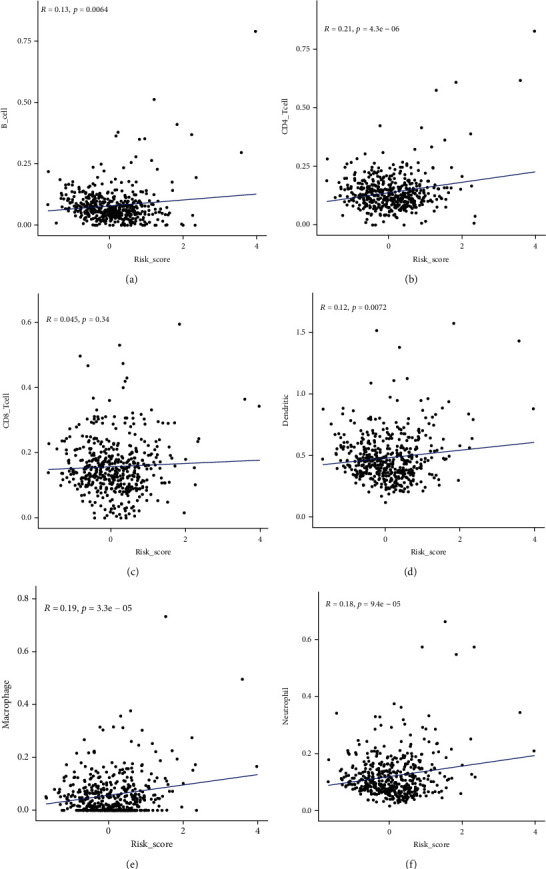
The correlation between the eight-gene risk score and immune cell levels. (a) B cell. (b) CD4+T cell. (c) CD8+T cell. (d) Dendritic cell. (e) Macrophage. (f) Neutrophil.
Official websites use .gov
A
.gov website belongs to an official
government organization in the United States.
Secure .gov websites use HTTPS
A lock (
) or https:// means you've safely
connected to the .gov website. Share sensitive
information only on official, secure websites.
The correlation between the eight-gene risk score and immune cell levels. (a) B cell. (b) CD4+T cell. (c) CD8+T cell. (d) Dendritic cell. (e) Macrophage. (f) Neutrophil.