
Figure 13.
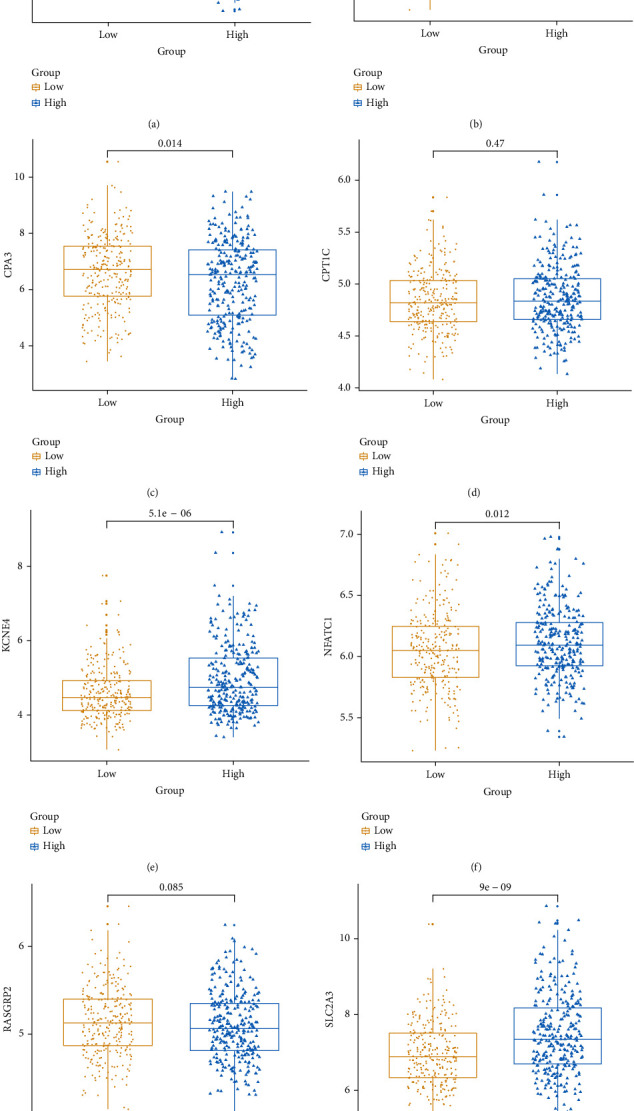
The expression patterns of the eight genes in the risk score model between high and low risk score were validated using an independent dataset. (a) CCL22. (b) CD36. (c) CPA3. (d) CPT1C. (e) KCNE4. (f) NFATC1. (g) RASGRP2. (h) SLC2A3.
Official websites use .gov
A
.gov website belongs to an official
government organization in the United States.
Secure .gov websites use HTTPS
A lock (
) or https:// means you've safely
connected to the .gov website. Share sensitive
information only on official, secure websites.
The expression patterns of the eight genes in the risk score model between high and low risk score were validated using an independent dataset. (a) CCL22. (b) CD36. (c) CPA3. (d) CPT1C. (e) KCNE4. (f) NFATC1. (g) RASGRP2. (h) SLC2A3.