
Figure 9.
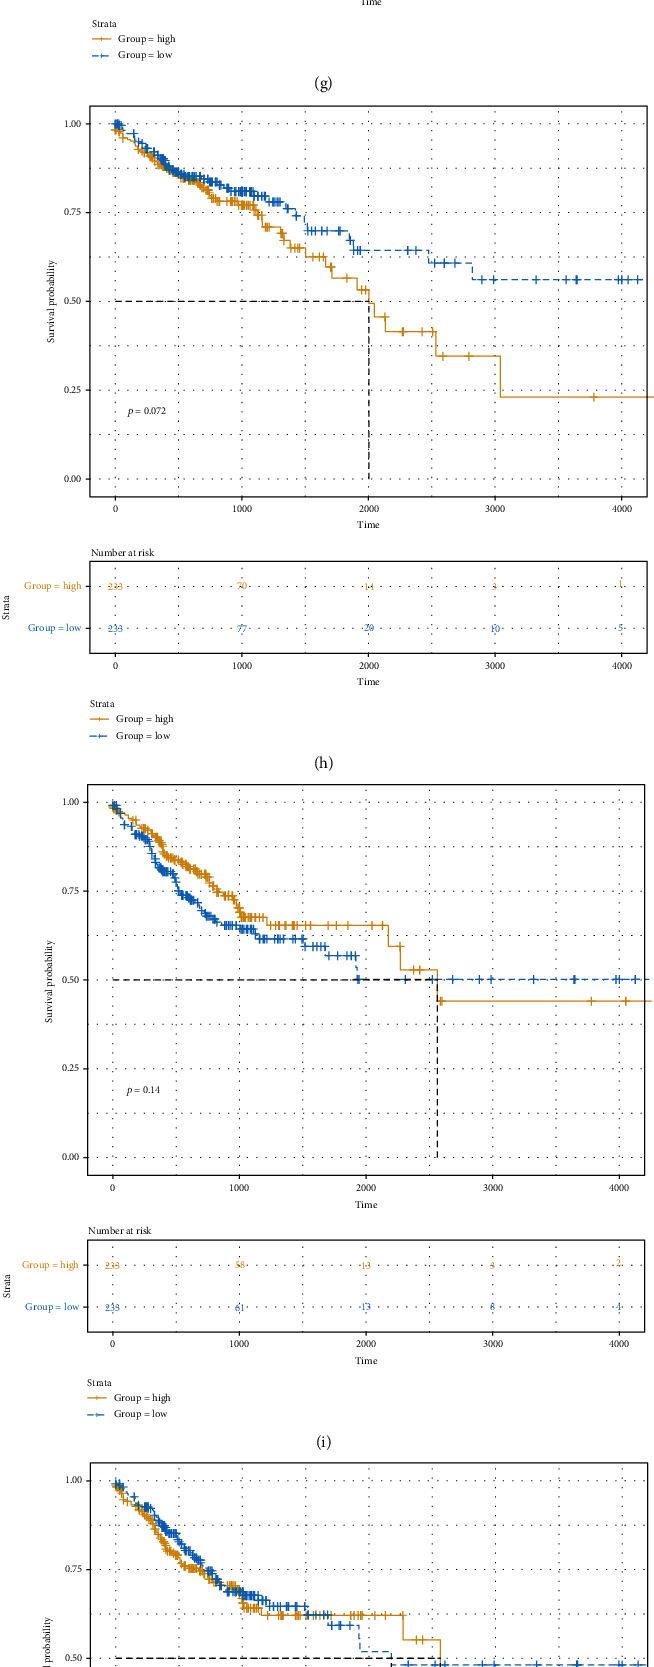
Kaplan-Meier plot of OS and PFS for the eight genes in the risk score model between high and low risk score. Kaplan-Meier OS results for (a) CCL22, (b) CD36, (c) CPA3, (d) CPT1C, (e) KCNE4, (f) NFATC1, (g) RASGRP2, and (h) SLC2A3. Kaplan-Meier PFS results for (i) CCL22, (j) CD36, (k) CPA3, (l) CPT1C, (m) KCNE4, (n) NFATC1, (o) RASGRP2, and (p) SLC2A3.