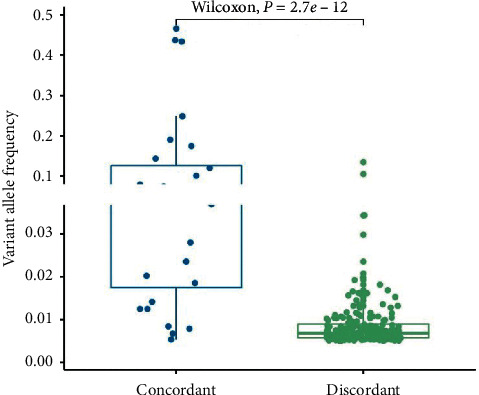
Figure 3.

Comparison of VAF between concordant and discordant ctDNA mutations. Boxplot displayed the minimum, maximum, median, and interquartile range of VAF of ctDNA. Concordant ctDNA mutations had higher frequency than discordant ctDNA mutations (p < 0.001, Wilcoxon rank sum test).
