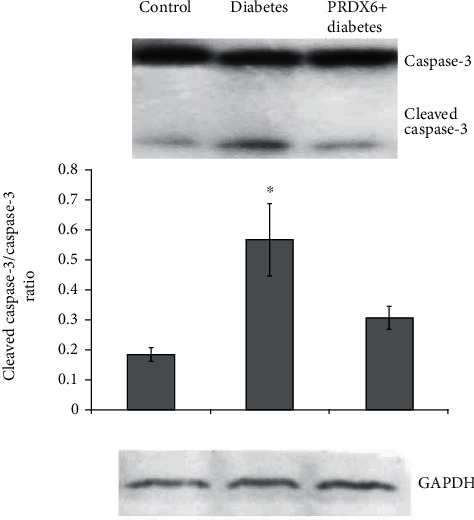
Figure 2.

Expression of caspase-3 and cleaved caspase-3, determined using western blot analysis. Representative blots from three independent experiments are shown. Histograms show the protein levels normalised to those of GAPDH, used as a loading control, and to total forms of relative proteins and represent the average densitometry values for the blots from two experiments (mean ± SD). ∗p < 0.05 vs. control.
