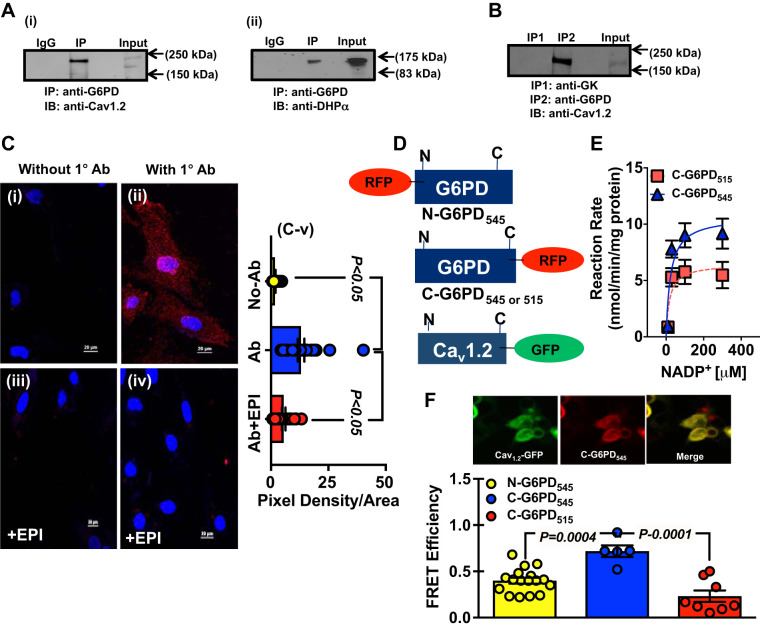
Fig. 3.
Glucose-6-phosphate dehydrogenase (G6PD) interacts with Cav1.2, a α1c-subunit of L-type Ca2+ channels. A: whole cell homogenates obtained from bovine coronary artery (BCA) were immunoprecipitated (IP) using anti-G6PD antibody and immunoblotted (IB) with anti-Cav1.2 (A,i) and anti-dihydropyridine (DHP)-α2 (A,ii) antibodies, respectively. B: in separate experiments, whole cell homogenates obtained from BCA were subjected to coimmunoprecipitation assays with anti-G6PD and anti-glucose kinase (GK) antibodies, respectively, and immunoblotted with anti-Cav1.2 antibody. C: G6PD-Cav1.2 interaction was detected in fixed vascular smooth muscle cells (VSMCs) using Duolink Proximity Ligation Assay (PLA). The pictures show a maximum intensity projection of the raw image. C,i and C,ii: the image was acquired in one z-plane. Assays were performed in bovine coronary artery smooth muscle cells (BCASMCs) without the presence (C,i) of the anti-G6PD antibody (without 1 Ab) and in the presence (C,ii) of anti-G6PD antibody (with 1°Ab). PLA signals are shown in red (positive reaction) and the nuclei in blue (negative reaction). C,iii and C,iv: BCASMCs were treated with epiandrosterone (EPI; 100 μM) for an hour, and G6PD-Cav1.2 interaction was assessed using Duolink PLA in the absence and presence of anti-G6PD antibody. C,v: summary data of pixel density-to-area ratio from PLA experiment are shown (No-Ab: n = 20 observation/cells from 5 separate experiments; Ab: 25 observation/cells from 5 separate experiments; and Ab + EPI: 20 observations/cells from 5 separate experiments). D: schematic representation of human Cav1.2-green fluorescent protein (GFP) and red fluorescent protein (RFP)-tagged G6PD constructs. E: G6PD activity was determined for C-G6PD545 and C-G6PD515, respectively. Enzyme kinetics demonstrated that G6PD545 had a higher Vmax than G6PD515; n = 5 experiments in each group. F: Förster resonance energy transfer (FRET) was performed using HEK293-17T cells that were cotransfected with Cav1.2-GFP and RFP-G6PD constructs. Graph represents the cumulative data from FRET analyses demonstrating energy transfer efficiency between Cav1.2-GFP + N-G6PD545 (left) (n = 17 observations from 5 separate experiments) Cav1.2-GFP + C-G6PD545 (middle) (n = 5 observations from 5 separate experiments), and Cav1.2-GFP+C-G6PD515 (right) (n = 8 observations from 5 separate experiments), respectively.

