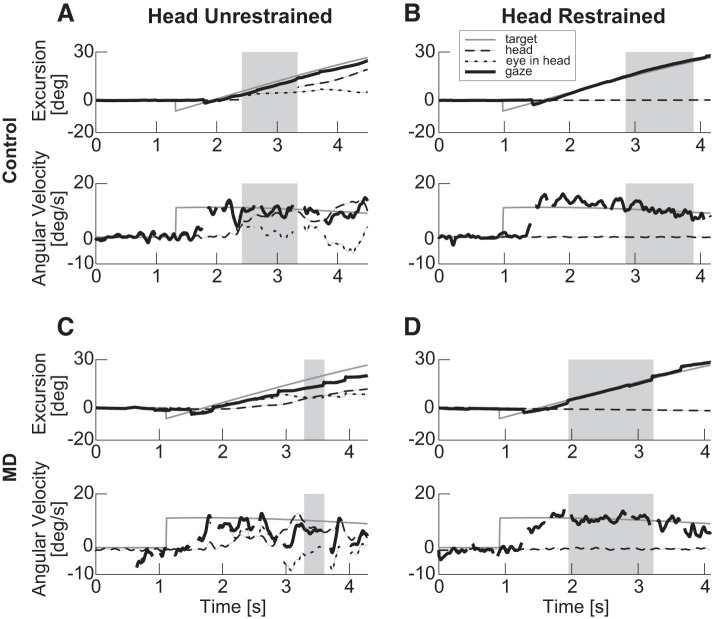
Fig. 1.
Example eye and head position and velocity data for 1 control (A and B, participant C2) and 1 participant with age-related macular degeneration (MD) (C and D, participant P5). A and C: head-unrestrained condition. B and D: head-restrained condition. The target ramp was in the rightward direction (0°) on all 4 trials. Top: position. Bottom: velocity data. Dashed black line: head, dotted black line: eye in head, solid black line: eye in space (gaze), and gray line: target. Regions designated by gray rectangles are those chosen as periods of longest continuous pursuit for the particular trial. All metrics are along the horizontal direction.

