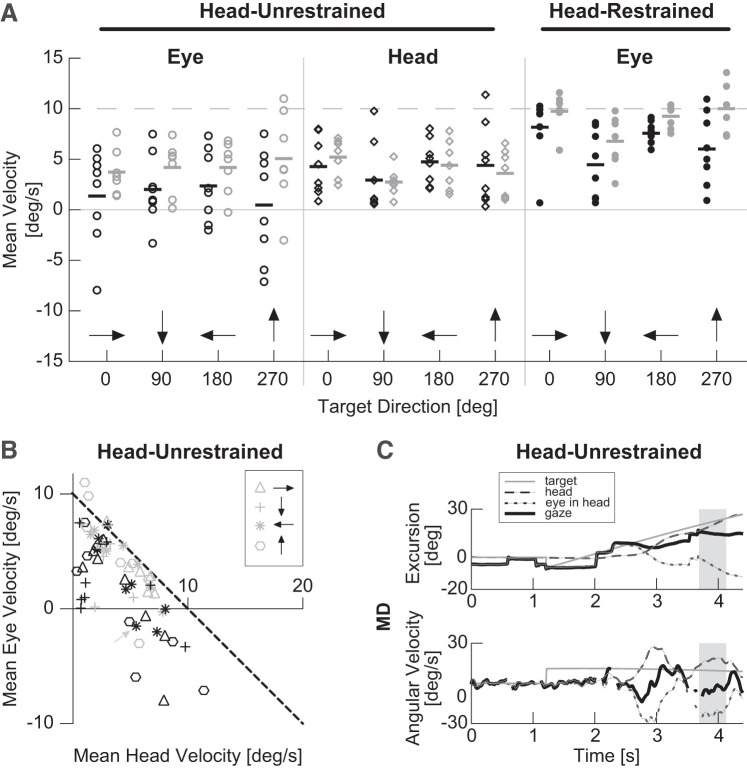
Fig. 3.
Mean eye and head velocity during longest period of continuous pursuit plotted across target directions. A: mean eye and head velocity is plotted for the head-unrestrained condition (columns 1 and 2) and mean eye velocity is plotted for the head restrained condition (column 3). Gray dashed line indicates target velocity. Black and gray horizontal bars indicate median velocity for each group/condition. B: mean eye and head velocity data from Head-Unrestrained columns in A are plotted against each other. Black dashed line represents perfect smooth pursuit gaze velocity. Each dot represents a control (gray) or macular degeneration (MD) participant (black). Data for trials in the head-unrestrained condition are designated with open symbols. Black arrows indicate target direction. C: single head-unrestrained horizontal smooth pursuit trial for participant P6 (gray dashed arrow in B). Top: position. Bottom: velocity data. Dashed black line: head, dotted black line: eye in head, solid black line: eye in space (gaze), and gray line: target. Region designated by gray rectangles was chosen as period of longest continuous pursuit for the given trial.

