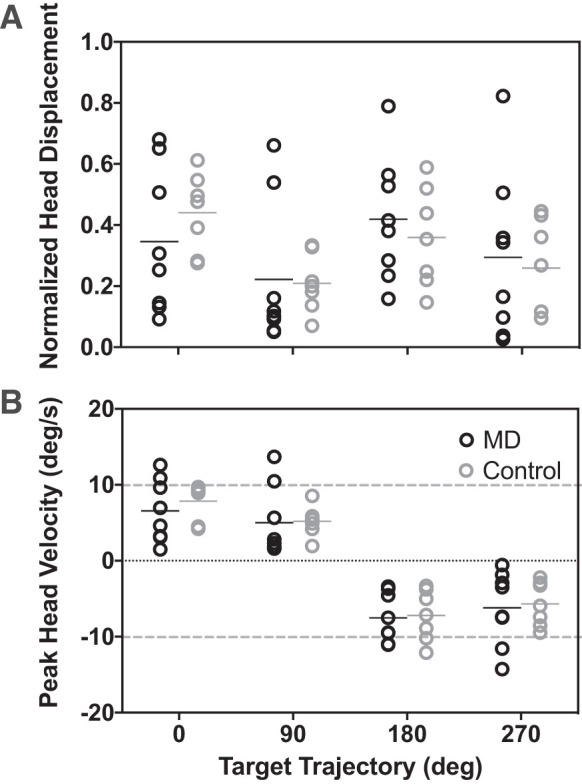
Fig. 4.

Head movement during smooth pursuit. A: total mean head displacement across the entire trial normalized by total target displacement. B: mean peak head velocity during the period of longest continuous pursuit. Sign corresponds to target direction; gray dashed lines demarcate target velocity. Black circles: participants with macular degeneration; gray: controls. Black and gray horizontal bars mark median values for each distribution.
