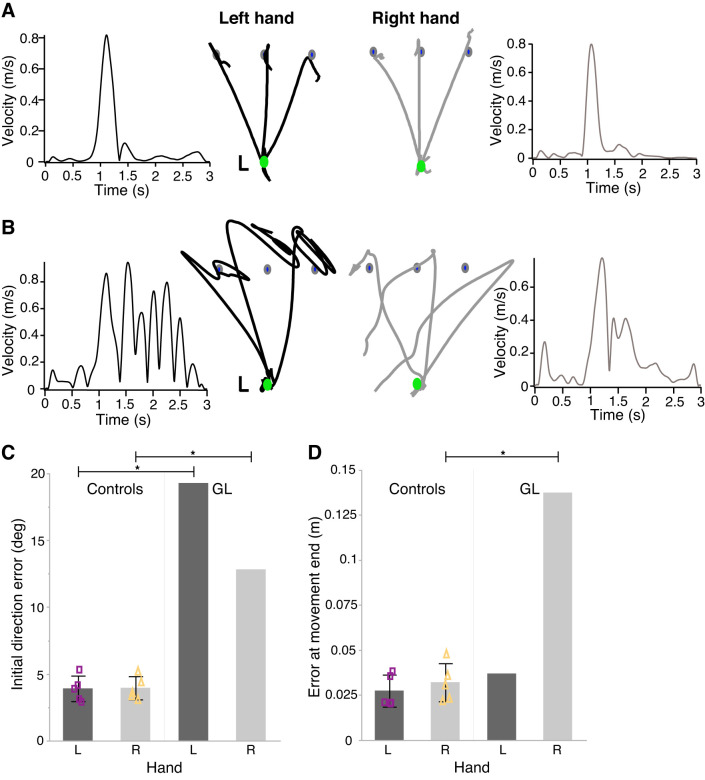
Fig. 2.
Different behaviors exhibited by each hand in the absence of somatosensation. Substantial performance differences between hands are evident in the deafferented patient’s (GL) movements but not in those of neurologically intact control participants. A and B: hand paths and velocity profiles are shown in a representative participant in the control group (A) and in GL (B). Scale bars = 2-cm hand movement. C and D: mean initial direction error (C) and mean error at movement’s end (D) are displayed for each hand of control participants and GL (woman). Error bars in control data represent 1 SD from the mean (n = 5, 4 women). Mean values for each control participant are plotted as purple squares [left hand (L)] or yellow triangles [right hand (R)]. Crawford and Howell modified t test was used: *P < 0.001, statistically significant difference.

