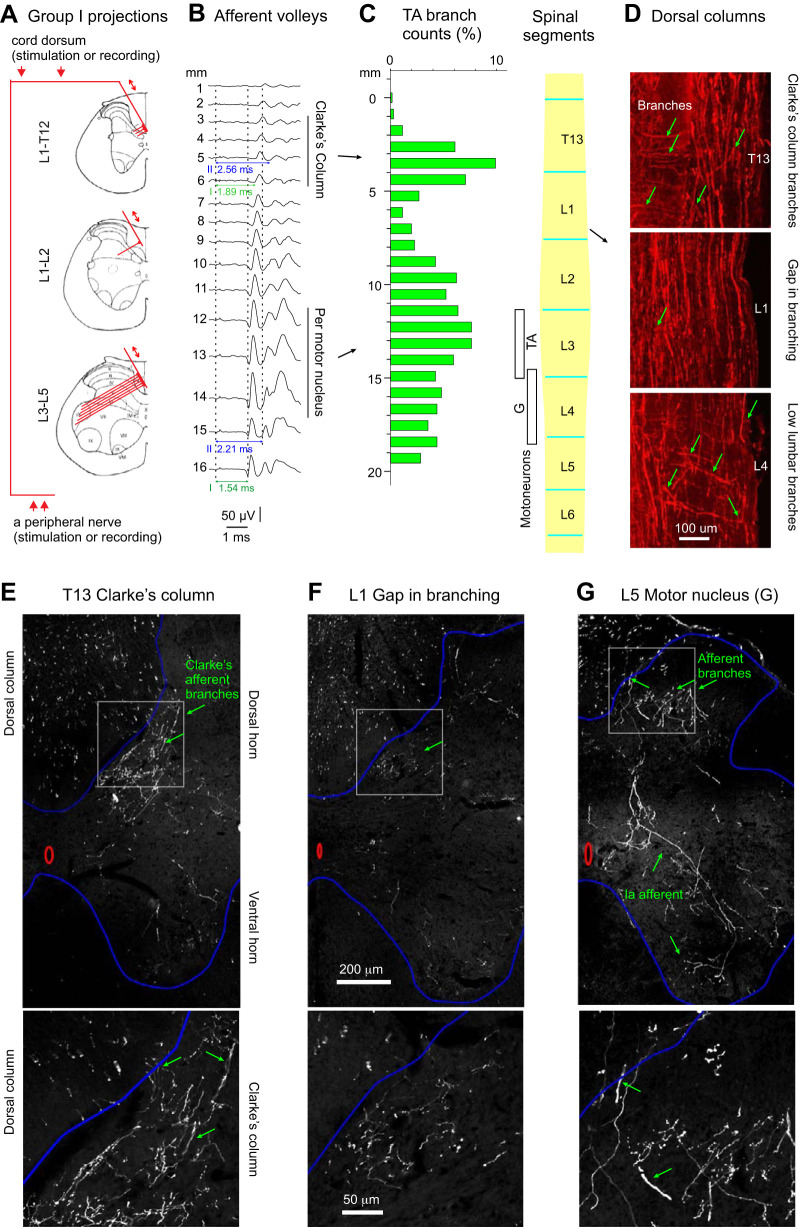
Fig. 1.
Rostrocaudal distribution of branching points of largest muscle afferent fibers traversing the dorsal columns. A: diagrams indicating the predicted degree of density of collaterals of group I and group II peroneal (Per) muscle afferents issued from the dorsal columns within the Th13–L5 segments. Double arrows above the 3 diagrams indicate the direction of impulses, either toward the peripheral nerves following stimulation of the dorsal columns (2 arrows above the top diagram) or toward the spinal cord following stimulation of the peripheral nerve (2 arrows below the bottom diagram). B: afferent volleys evoked by stimulation of the common peroneal nerve at 5T. They were recorded from the surface of the spinal cord (cord dorsum) at sites 1 mm apart over a distance of 16 mm between the Th13 and the L5 segments. The 1st component, attributed to group I muscle afferents, appeared at stimulus intensities of 1T and was maximal at 2T. The 2nd component, attributed to group II afferents, appeared at 2.2T and was maximal at 5T. The dotted vertical lines indicate the onset of the stimulus artifact and the positive peak of afferent volleys in group I and group II afferents, respectively. The horizontal lines indicate the latencies of group I and group II afferent volleys with respect to the stimulus artefacts. The vertical lines to the right indicate the estimated location of Per motor nuclei in L3–L4 segments and the caudal extent of the rat Clarke’s column. C: histogram of the number of tibialis anterior (TA) afferent branches arising from the dorsal columns per millimeter along the T13–L5 segments of the spinal cord, normalized to the total branch count in one of the rats with viral TA muscle labeling with AAV9-CAG-tdTom. Location of TA and gastrocnemius (G) motoneurons labeled in this rat is indicated with white boxes, next to the schematic of the lumbosacral enlargement with segments lengths drawn to the scale used for the afferent count histogram. D: example sagittal sections including images of TA (afferent branches arising from the dorsal columns within T13, L1, and L4 segments (green arrows) in 1 of the rats. Epifluorescence microscopy using a ×10 objective. E–G: examples of transverse sections illustrating G afferent branches arising from the dorsal columns within T13, L1, and L5 segments (green arrows). Confocal microscopy with a ×25 water immersion objective. Boxed parts in top images are enlarged in bottom images.

