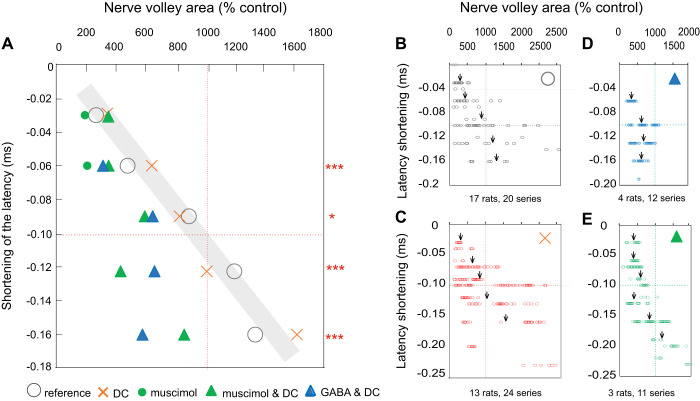
Fig. 5.
Relationship between the latency and size of nerve volleys in group I afferents evoked by stimulation of the dorsal column during the postpolarization period. A: the relationship between the shortening of latencies and the increase in the size of the nerve volleys (expressed as the mean latency shift and the mean area of nerve volleys evoked during the postpolarization period) in % of the control area. Circles, nerve volleys evoked by increasing stimulus intensities (near-threshold to 50 µA); they are taken as the reference. Crosses, data for nerve volleys evoked by a constant intensity near-threshold stimuli that were increased by the preceding polarization (1 µA for 1 min). Triangles, as crosses but when direct current (DC) effects were associated with effects of muscimol or GABA. Asterisks indicate statistically significant differences in latencies of volleys shortened by 0.5–0.7, 0.8–0.11, 0.12–0.14, and 0.15–0.18 ms by GABA or muscimol, as compared with volleys represented by crosses. *P = 0.05–0.001, ***P ≤ 0.001. The estimates are based on the t test and apply to effects of both GABA and muscimol. B–D: detailed plots from which the mean values in A were derived. Arrows indicate mean values within the above-indicated ranges. Note the reduced scales. Dotted lines correspond to a 1,000% increase in the size and 0.1-ms shortening of the latencies.

