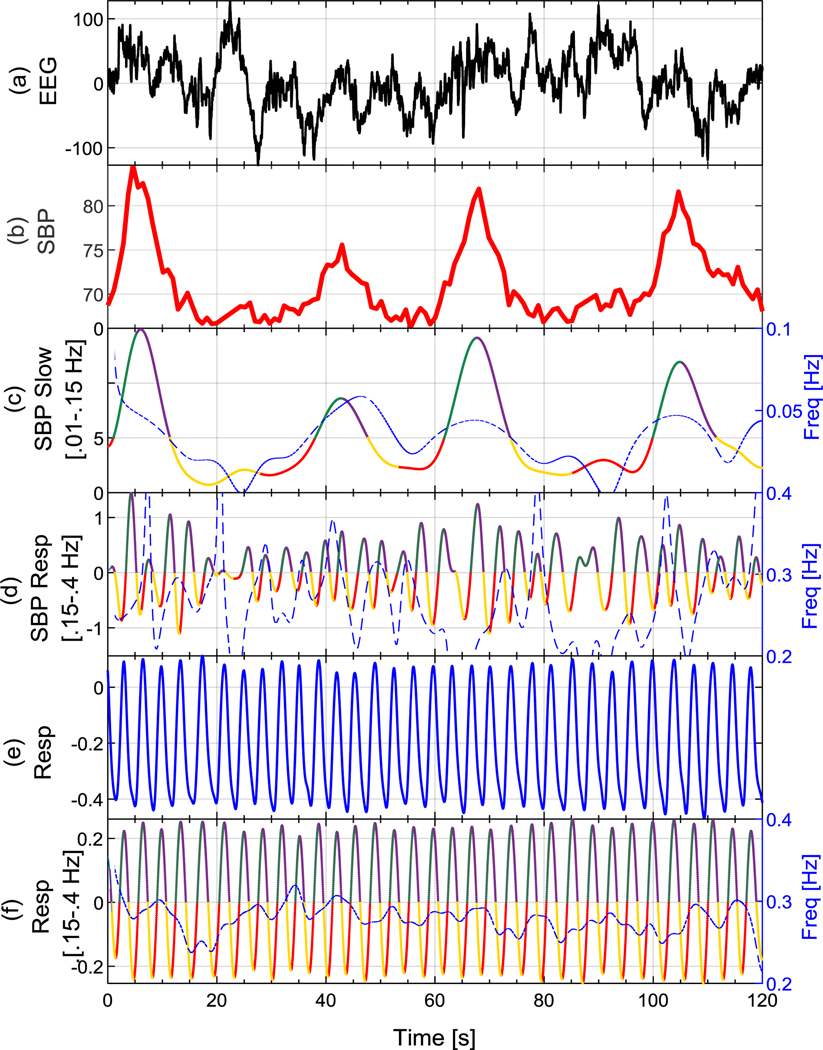
Figure 1.
Examples of (a) EEG, (b) SBP, (c) SBP slow component, (d) SBP respiratory component, (e) raw respiration, and (f) filtered respiration signals. The extracted phases of peripheral oscillations using Hilbert transform are shown in Fig1(c), (d), and (f), where phases 1 through 4 are shown in red, green, purple, and yellow, respectively. The instantaneous frequency of each oscillation is plotted on its top in blue dashed lines.

