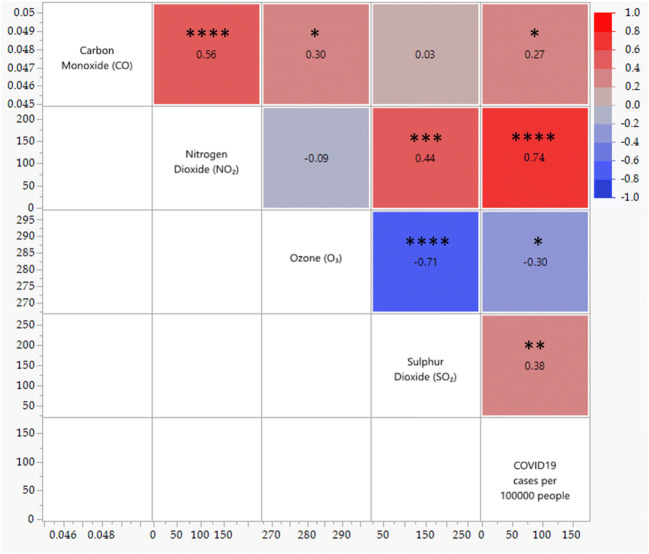
Fig. 7.
Scatterplot matrix of Pearson’s correlation among air pollutants and between air pollutants’ concentrations and COVID-19 confirmed cases. ****indicates P < 0.0001, ***indicates P < 0.001, **indicates P < 0.01, and *indicates P < 0.05; the scale bar represents the correlation coefficient value (r)

