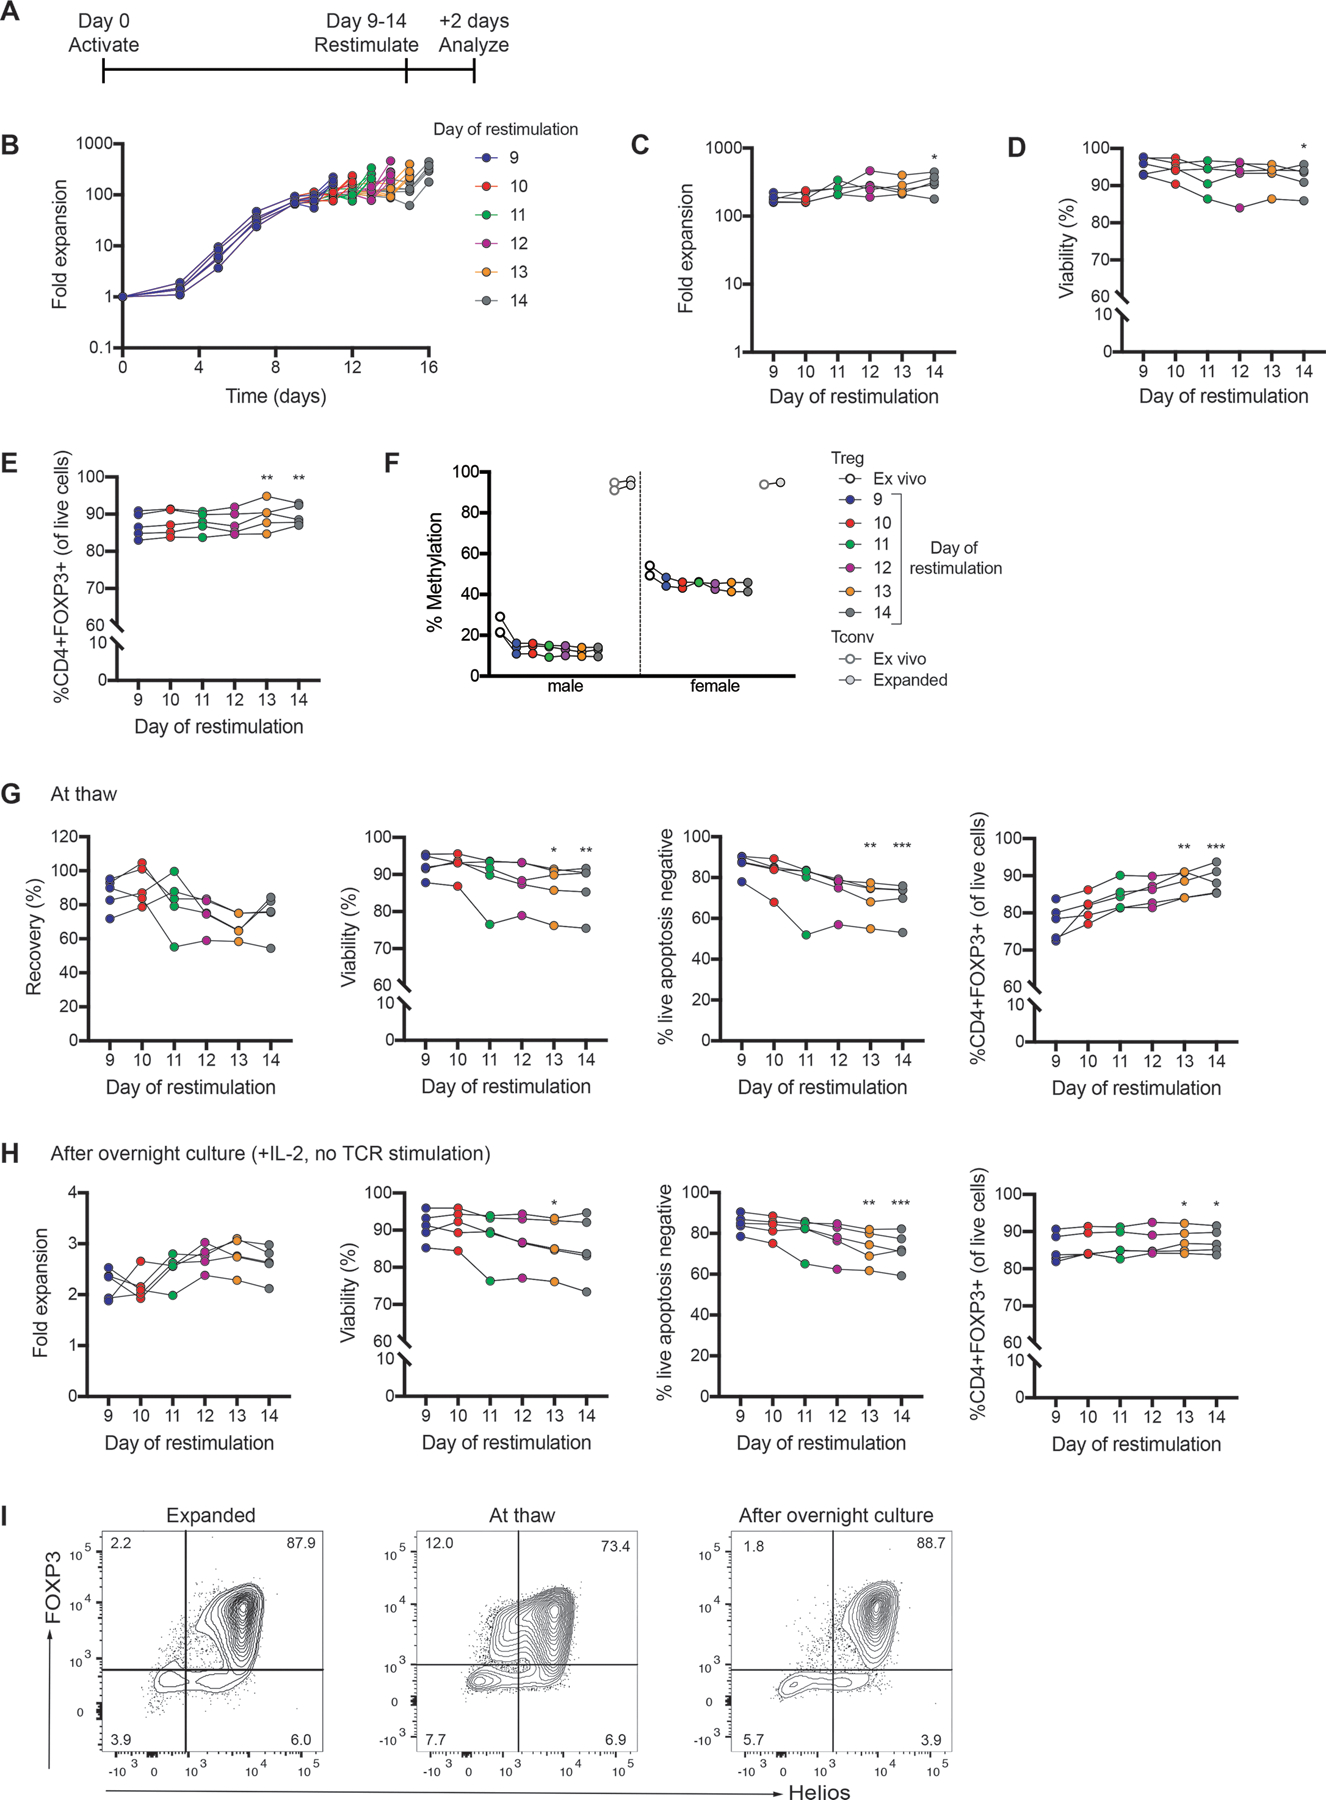
Figure 8: Effect of restimulation on day 9–14.

Isolated thymic Tregs were expanded with Treg Xpander and restimulated on day 9–14 as indicated in (A). In each case, cells were analyzed and cryopreserved 2 days following restimulation. (B) Fold expansion of thymic Tregs restimulated on day 9–14. The day in the legend refers to the day cells were restimulated. (C) Fold expansion, (D) viability and (E) FOXP3 expression measured 2 days following restimulation. (F) TSDR analysis of ex vivo and expanded thymic Tregs and Tconv. Average data from male and female donors shown is the average methylation for 7 CpGs within the TSDR. (G) Recovery (defined as the number of live apoptosis negative cells thawed relative to the number of live cells cryopreserved), viability (measured by acridine orange/propidium iodide staining and apoptosis assay) and FOXP3 expression for cryopreserved thymic Tregs shown at thaw. (H) Fold expansion, viability (measured by acridine orange/propidium iodide staining and apoptosis assay) and FOXP3 expression for cryopreserved thymic Tregs after thawing and overnight culture with IL-2. (I) Flow cytometry plots are shown for a representative donor. For B-F, each symbol represents cells from a different subject and matched subjects are linked. For G-H, each symbol represents the mean of 3 technical replicates of cryopreserved cells from a different subject and matched subjects are linked. n=5 from 3 experiments. *P < 0.05, **P < 0.01, ***P < 0.001 as determined by a Friedman test with Dunn’s multiple comparison test to compare each restimulation day to day 9.
