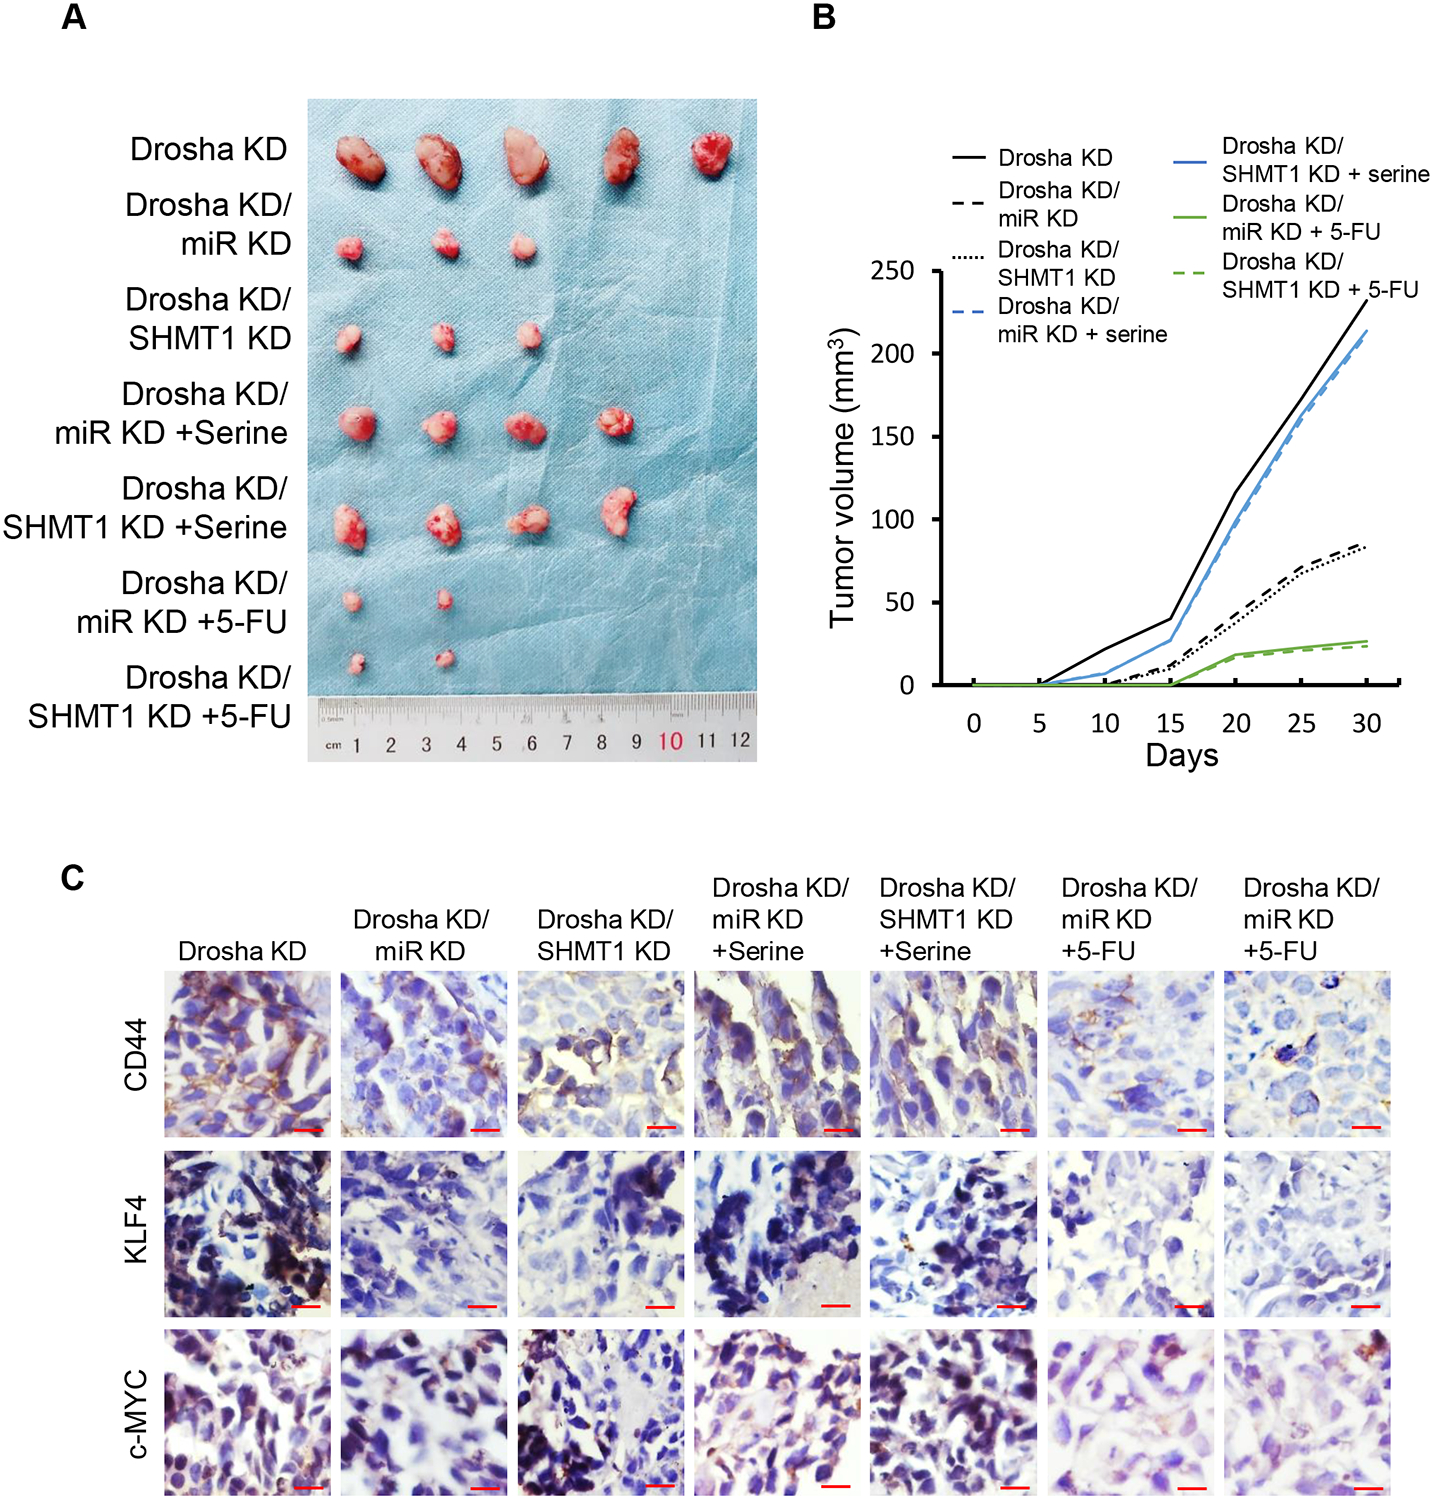
Figure 7. Effects of miR-6778–5p and SHMT1 on gastric cancer tumourigenesis in vivo.

The indicated GCSCs (1×10⁵) were subcutaneously injected into nude mice. Images of tumour sizes and their corresponding tumour growth curve are shown. The mice were injected with MGC-803/Drosha KD/miR-6778–5p KD, MGC-803/Drosha KD/SHMT1 KD, and the control cells MGC-803/Drosha KD. The mice were given serine (130 mg/kg) and 5-FU (30 mg/kg) at 5 days after cell injection. (A) Representative images of tumours in the indicated nude mice xenografts. (B) Tumour growth curve corresponding to (A). (C) Representative images of CSC-associated gene expression by IHC staining in the indicated xenografts (magnification: ×400; scale bar: 50 μm).
