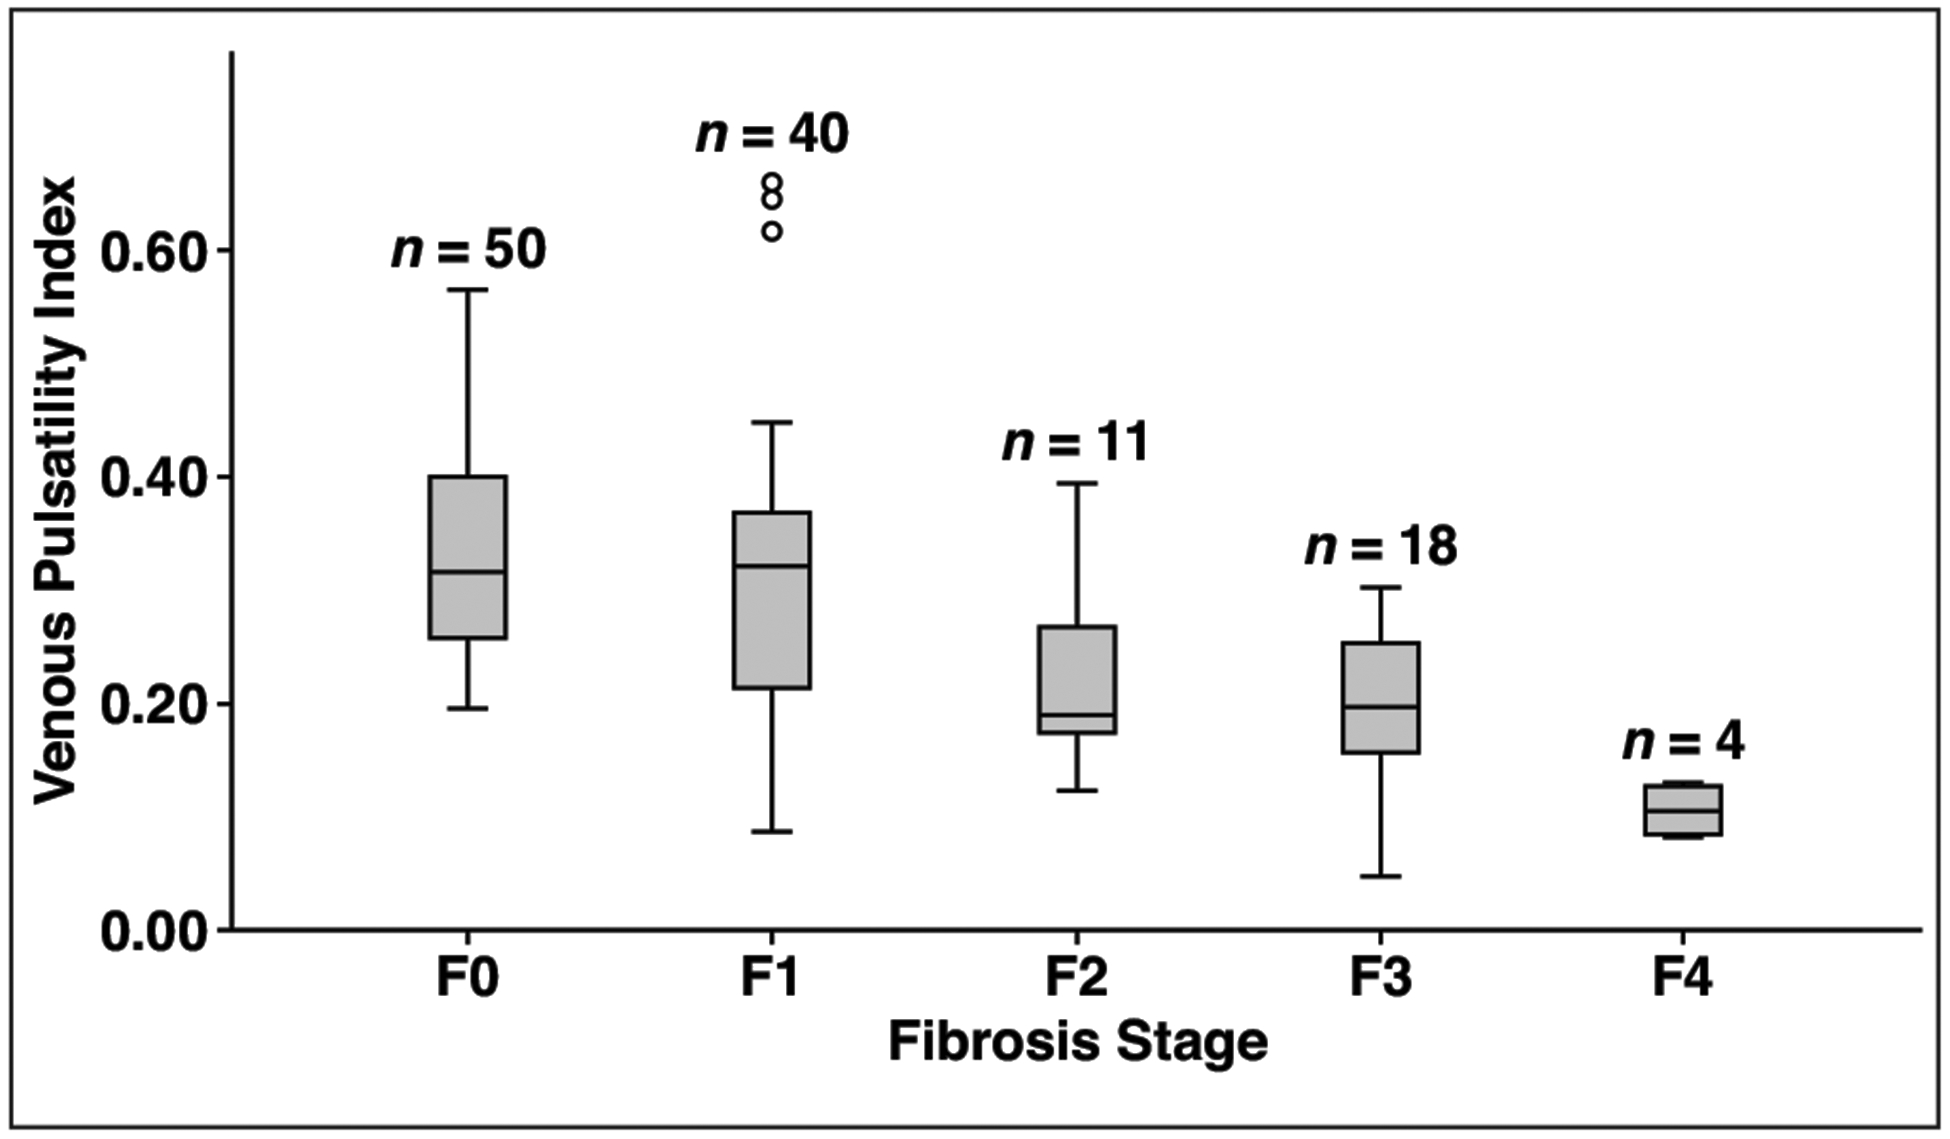
Fig. 2—

Box plot shows that higher fibrosis stages are associated with lower venous pulsatility index (VPI). In particular, VPI in high-risk nonalcoholic fatty liver disease (NAFLD) (≥ F2) appears less than VPI in low-risk NAFLD (F0–F1). Upper and lower limits of whiskers are defined as highest and lowest values within 1.5 interquartile range of upper (75th percentile) and lower (25th percentile) limits of box. Circles denote outliers.
