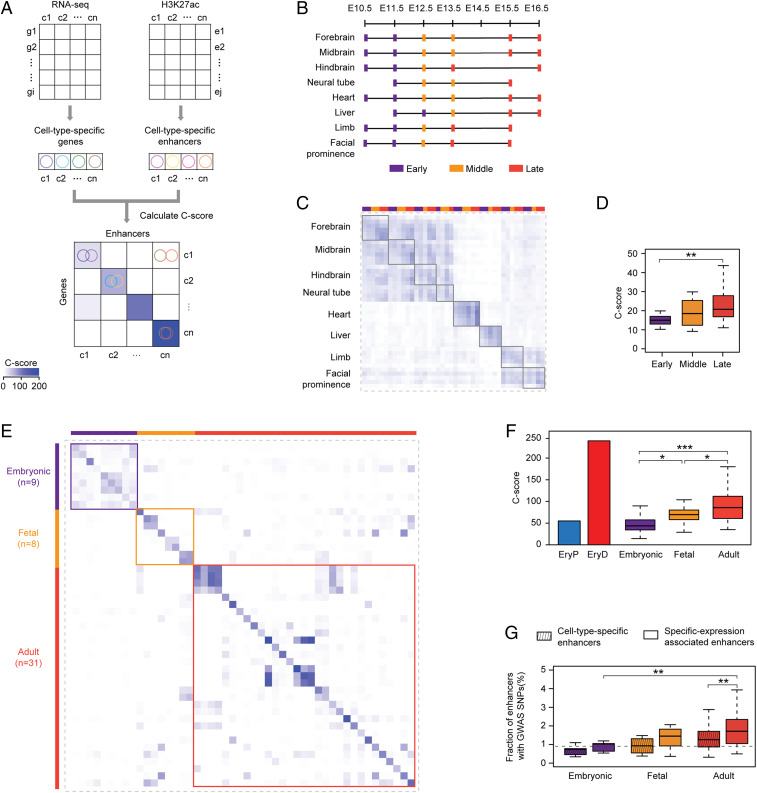
Fig. 5.
Enhancers contribute to cell-type–specific gene expression progressively with increasing age of ontogeny. (A) Schematic of unbiased evaluation of contribution of cell-type–specific enhancer to gene expression in ENCODE and Roadmap datasets. (B–D) Contribution of cell-type–specific enhancer to gene expression in ENCODE datasets. (B) The schematic diagram of tissues and developmental ages. C-score matrix (C) and statistical analysis of C-scores (D) are presented. (E and F) Contribution of cell-type–specific enhancer to gene expression in Roadmap datasets is represented by C-score matrix (E) and statistical analysis of C-scores (F). Samples were classified into three stages as highlighted. (G) Enrichment analysis of GWAS SNPs in cell-type–specific enhancers and specific-expression associated enhancers in Roadmap datasets. In box plot, the box represents the 25th and 75th percentiles, while the whiskers represent the 5th and 95th percentiles. *P < 0.05, **P < 0.01, ***P < 0.001, unpaired one-tailed Student’s t test (D, F, and G).

