Fig. 5.
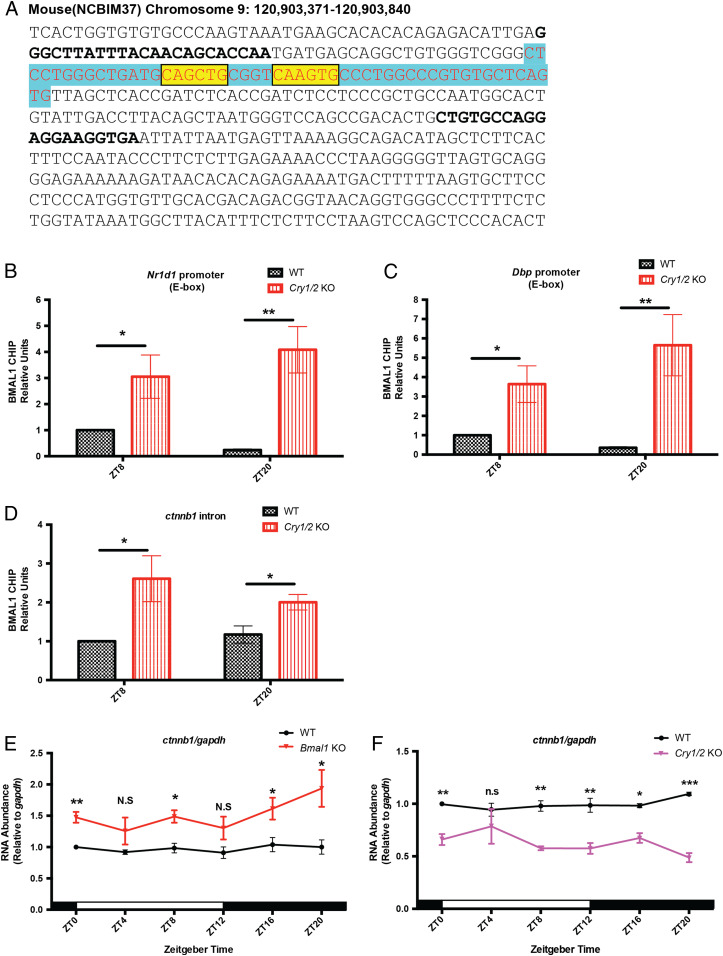
Transcription of Ctnnb1 is controlled by circadian clock proteins. (A) Sequence of the BMAL1 binding site in the Ctnnb1 intron region is in blue (10, 12, 38). Nucleotides conserved in the E-box-like (CANNTG) sequences are colored in yellow. Nucleotides targeted by qPCR primers are marked by bold font. (B–D) Levels of BMAL1 binding to the Nr1d1 E-box, Dbp E-box, and Ctnnb1 intron region in the spleens of WT and Cry1/2 KO mice. For each genotype and time point, at least three mice were used for quantification. Error bars correspond to SEM. Data were normalized to a value of 1 for WT at ZT8. *P < 0.05, **P < 0.01, as determined by the t test. (E and F) Ctnnb1 mRNA levels in spleen samples from WT, Bmal1 KO, and Cry1/2 KO mice detected by reverse transcription-qPCR. Three biological repeats were used for quantification. White and black bars indicate lights on and lights off, respectively. Error bars correspond to SEM. Data were normalized to a value of 1 for WT at ZT0. N.S/n.s, not significant, *P < 0.05, **P < 0.01, ***P < 0.001, as determined by the t test.

