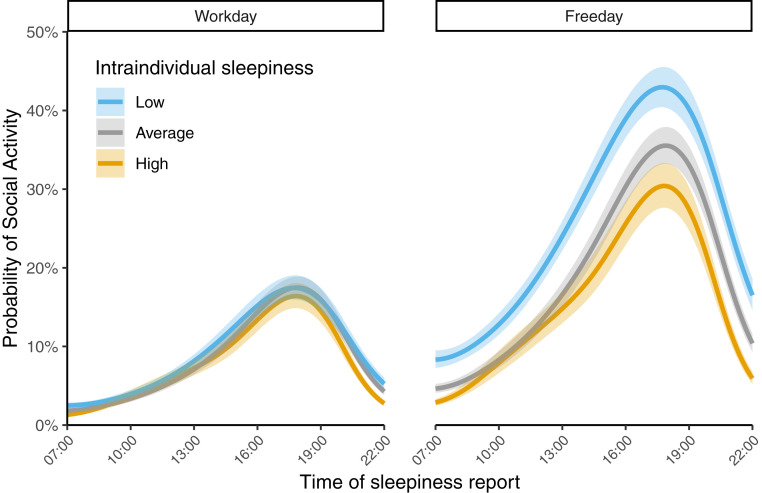
Fig. 2.
Probability of being socially active for three intraindividual sleepiness levels at different times of day, split by type of day. High sleepiness represents a KSS of two steps above the participant's own average. Low sleepiness represents a KSS of two steps below the participant's own average. Average sleepiness is the mean sleepiness for each participant. Error ribbons represent pointwise 95% CIs. Since predictions are made independently of participants, each line does not necessarily represent a day when any specific person is sleepy/average/alert but rather the probability of any given person being socially active at that time point and sleepiness level.

