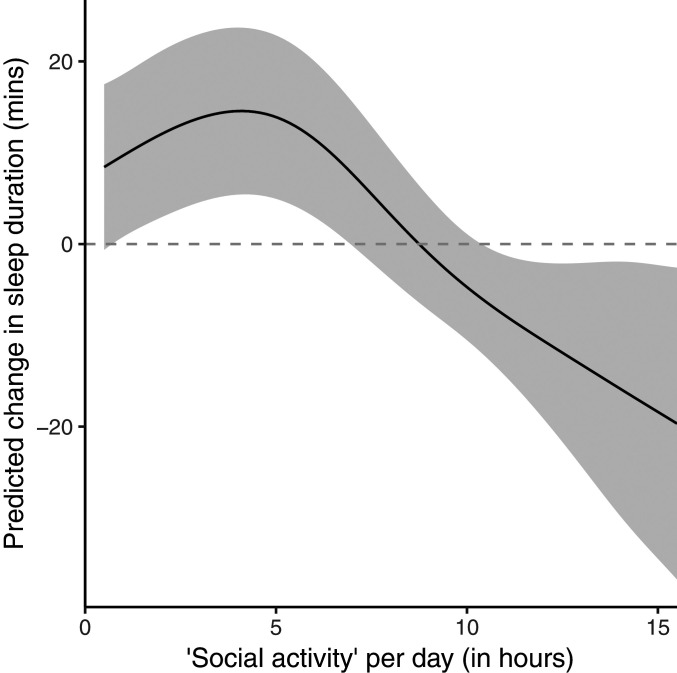
Fig. 5.
Plot representing the association between duration of social activity during the day and within-subject centered sleep duration (i.e., representing deviation from individual mean) during the following night. To increase ease of interpretability, 30-min periods of social activity have been converted to hours of social activity.

