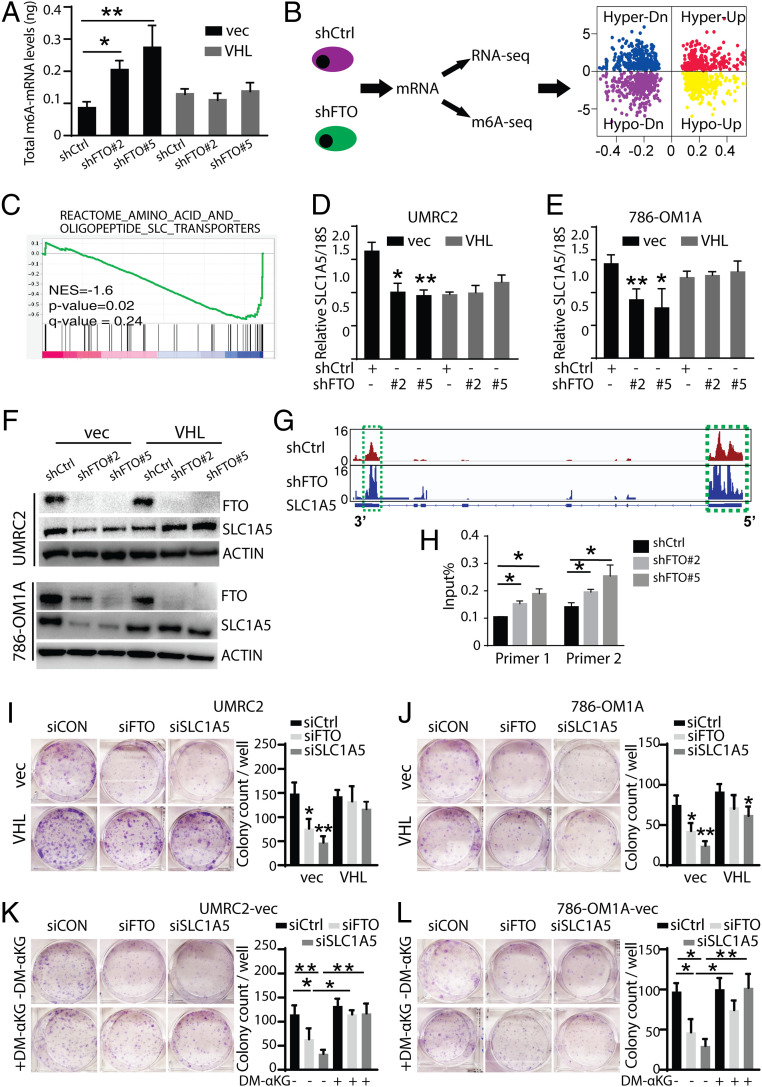
Fig. 5.
Integration of transcriptome-wide m6A-seq and mRNA-seq assays identify SLC1A5 as an FTO target in ccRCC. (A) Global m6A changes of UMRC2-vec and UMRC2-VHL cell lines by m6A mRNA-ELISA. (B) Workflow for RNA sequencing and m6A sequencing of UMRC2-vec transfected with shControl, shFTO#2, and shFTO#5. The quadrant plot indicates m6A levels and mRNA transcript abundance levels. The x-axis refers to log2 fold change in mRNA transcript abundance levels between shFTO and control cells. The y-axis indicates log2 fold change of m6A levels between shFTO and control cells. The different quadrants represent (I) hypermethylated and up-regulated genes (red), (II) hypermethylated and down-regulated genes (blue), (III) hypomethylated and up-regulated genes (yellow), and (IV) hypomethylated and down-regulated genes (purple). (C) Gene set enrichment analysis (GSEA) for the SLC transporter gene set from MSigDB. Genes were ranked based on the degree of differential expression between shFTO and shControl cells. A negative enrichment score indicates that genes belonging to these gene sets were significantly down-regulated in shFTO compared to shControl cells. (D and E) Real-time PCR analysis of SLC1A5 expression in shControl or shFTO UMRC2 (D) and 786-OM1A (E) cells. Data represent the average ± SD (*P < 0.05 and **P < 0.01 for indicated group vs. shCtrl). (F) Western blot analysis of FTO and SLC1A5 expression in UMRC2 (Top) and 786-OM1A (Bottom) shControl or shFTO cells. Data represent the average ± SD (*P < 0.05 and **P < 0.01). (G) The m6A abundances in SLC1A5 transcripts in shFTO and shControl UMRC2 cells as determined by m6A-seq. (H) Gene-specific m6A qPCR analysis of m6A level in SLC1A5 mRNA in shFTO and shControl UMRC2 cells. Primers 1 and 2 are targeting the 3′ UTR region of SLC1A5. Data represent the average ± SD (*P < 0.05 for indicated group vs. shCtrl). (I and J) Picture (Left) and quantification (Right) of 2D colonies in UMRC2-vec and UMRC2-VHL (L) or 786-OM1A-vec and 786-OM1A-VHL (J) cells transfected with siCtrl, siFTO, and siSLC1A5. (K and L) Picture (Left) and quantification (Right) of 2D colonies in UMRC2-vec (K) and 786-OM1A-vec (L) cells transfected with siCtrl, siFTO, and siSLC1A5 and cultured with or without dimethyl α-ketoglutarate (DM-αKG). Data represent the average ± SD. Student t test against corresponding control conditions (**P < 0.05 and **P < 0.01).

