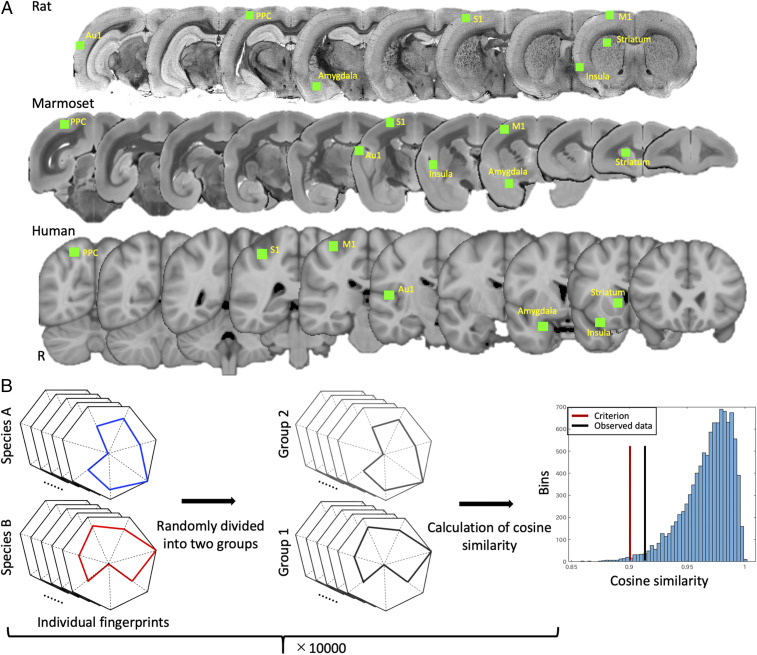
Fig. 2.
(A) ROI locations for fingerprint analysis. ROIs (all drawn in right hemisphere of respective atlases) are shown in green and overlaid on coronal slices of respective atlas anatomical images for rats (Top), marmosets (Middle), and humans (Bottom). (B) Schematic of permutation testing approach used for identifying statistically significant differences between fingerprints. Individual (i.e., scan level) fingerprints of two species were first randomly divided into two groups. Obtained fingerprints in each group were then averaged and normalized to a range of 0 and 1. Cosine similarity was then calculated across species. This process was iterated 10,000 times. The Right histogram shows a representative example of the results of permutation testing and shows the distribution of the test statistic, the criterion value (red line), and the observed value given by the data (black line). In this case, actual statistic value was higher than the criterion, indicating no significant differences.

