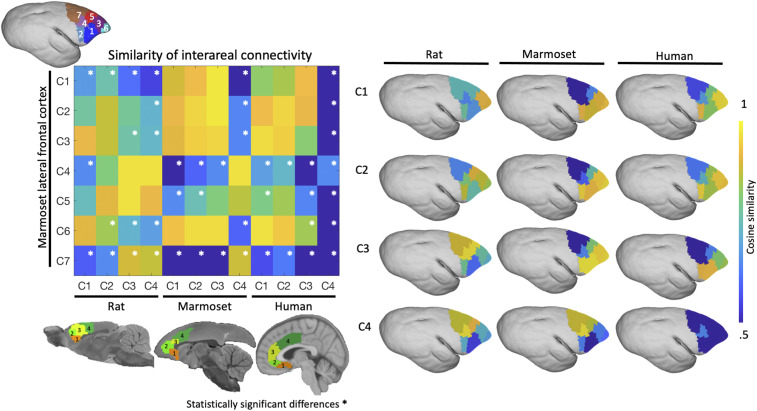
Fig. 4.
Similarity of interareal functional connectivity patterns between the MFC (in rats, marmosets, and humans) and LFC connectivity in marmosets (LFC derived from ref. 30). For each species, cosine similarity values are plotted in matrix form (Left). (Right) The similarity of each species’ interareal MFC connectivity with marmoset LFC connectivity; the constituent values are plotted directly on the marmoset LFC. A high cosine similarity value suggests that the connectivity values are more comparable than a lower cosine similarity value. Significant differences are marked by a white asterisk within the similarity matrix (Left).

