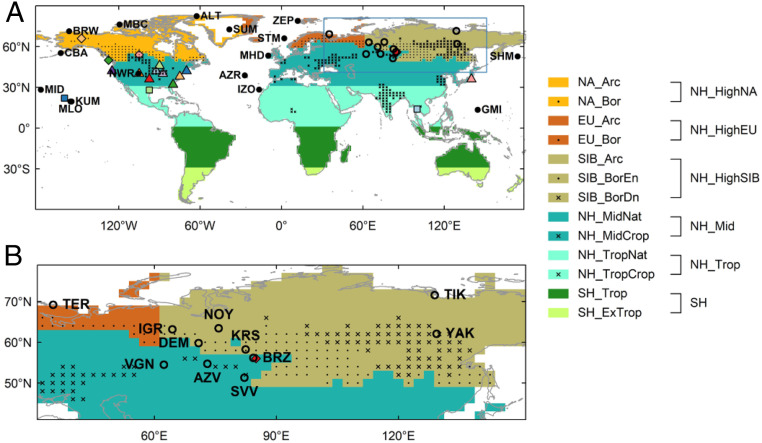
Fig. 1.
(A) Map of tagged regions and northern surface stations used in this study. Filled circles indicate stations from NOAA's GGGRN assimilated in CAMSv17r1 CO2 inversion, while open circles indicate Russian stations not assimilated. Colored symbols indicate grid cells where aircraft samples were assembled. (B) Close-up map from the blue box in A, marking Russian stations.

