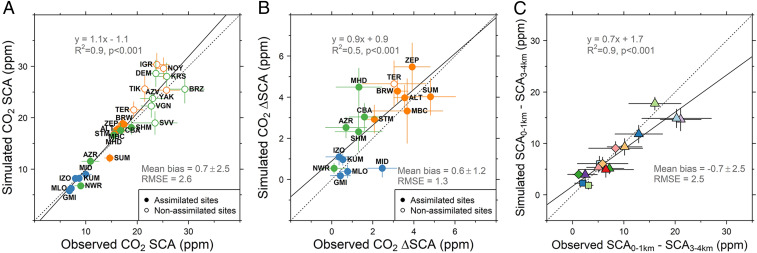
Fig. 2.
Evaluation of simulated versus observed (A) CO2 SCA, (B) CO2 ∆SCA, and (C) vertical difference in SCA between the altitude bins 0 to 1 km and 3 to 4 km. For A and B, filled (open) circles represent stations (not) assimilated in the CAMSv17r1 CO2 inversion. The orange, green, and blue circles indicate high-latitude (60 to 90 °N), midlatitude (30 to 60 °N), and low-latitude (0 to 30 °N) stations. Dotted and solid lines represent the unit line and least squares regression line, respectively. The colored symbols in C correspond to those in Fig. 1A. Error bars denote ±1σ.

