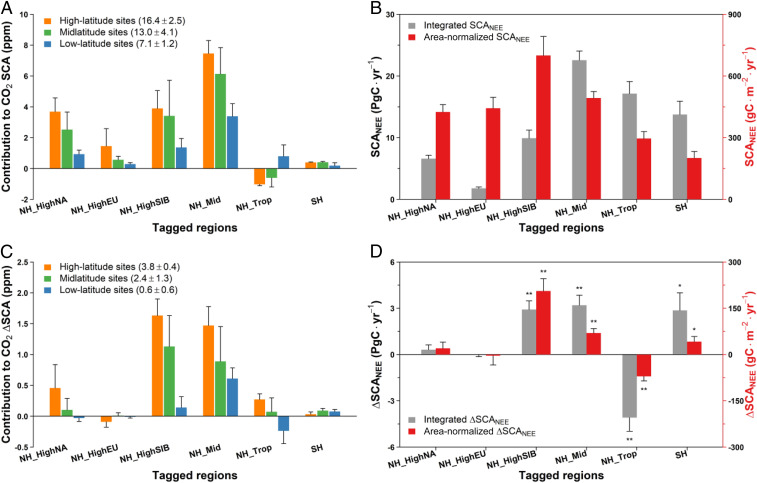
Fig. 3.
(A and C) Contribution of the six major tagged regions to site-level CO2 SCA and ∆SCA in relation to (B and D) their NEE seasonal amplitudes (SCANEE) and changes (∆SCANEE). For A and C, the orange, green, and blue bars represent flux imprints from different tagged regions on x axis for northern high-latitude (60 to 90 °N; n = 7), midlatitude (30 to 60 °N; n = 5), and low-latitude (0 to 30 °N; n = 5) stations, respectively, with the numbers in the parentheses showing the mean SCA or ∆SCA averaged within station groups. Only the 16 stations from NOAA's GGGRN and the nonassimilated station Teriberka in Russia are included. For B and D, the gray and red bars represent the integrated and area-normalized SCANEE or ∆SCANEE for different tagged regions. Analyses were based on NEE from the CAMSv17r1 inversion for 1980 to 2017.

