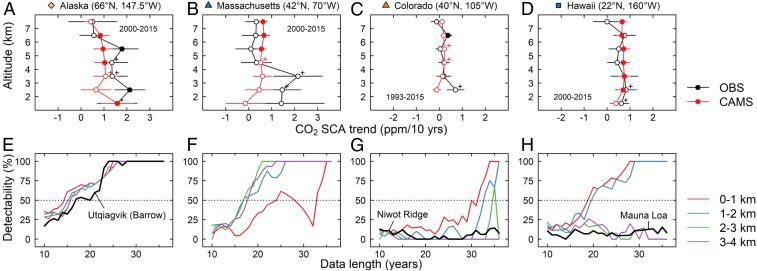
Fig. 5.
The trends in CO2 SCA for aircraft profiles at four sites. (A–D) Comparison of simulated versus observed SCA trends for altitude bins between 1 and 8 km from aircraft profiles in Alaska (A), Massachusetts (B), Colorado (C), and Hawaii (D). Filled circles represent significant trends (P < 0.05), whereas open circles with pluses represent marginally significant trends (P < 0.1). Error bars show ±1σ. (E–H) Significance of the SCA trend as a function of data record length based on model results at each site (see details in Materials and Methods). The point of intersection between each curve and the horizontal dotted line represents the minimal data length required to achieve ≥50% detectability of a significant trend. For E, G, and H, the black lines represent the detectability curves for observations from the background stations Utqiagvik (Barrow; 11 m asl), Niwot Ridge (3,523 m asl), and Mauna Loa (3,399 m asl), which are in good agreement with model results at corresponding altitude levels.

