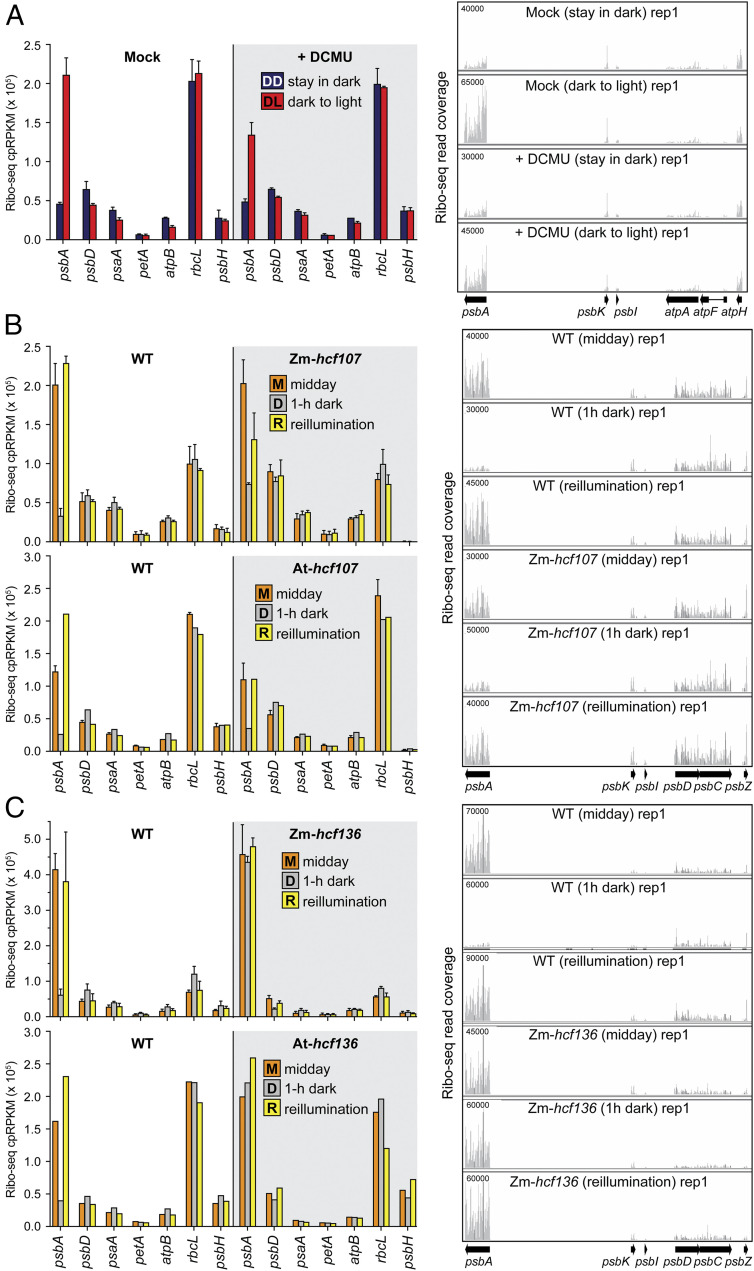
Fig. 5.
Ribo-seq analysis of effects of PSII disruptions on chloroplast ribosome occupancies in dark and light. Left shows ribosome footprint abundance for psbA and several other chloroplast genes. The values for all chloroplast genes are available in Dataset S1. Mean ± SD is shown for experiments that were performed with replicates. Several of the Arabidopsis mutant analyses lacked replicates, but results from the orthologous maize mutants demonstrate replicability. Right shows screen captures from the Integrated Genome Viewer (IGV) that display ribosome footprint coverage along psbA and adjacent ORFs. The y axis values indicate the number of reads at each position (not normalized). The maximum y axis values (shown in Upper Left) were chosen such that the magnitude for ORFs adjacent to psbA were similar among the conditions being compared. (A) Analysis of Arabidopsis (Col-0) after DCMU treatment. The treatments were as described in Fig. 4C and were performed in two replicates. IGV screen captures of the second replicate and data showing that psbA mRNA level is not affected by DCMU are shown in SI Appendix, Fig. S2. (B) Analysis of Zm-hcf107 and At-hcf107 mutants. The data show the known loss of psbH expression in these mutants (60, 81). Two replicates were performed for Zm-hcf107. One of the replicates of the midday At-hcf107 samples was published previously (81). The IGV images are from maize data. IGV screen captures of replicates and data showing that psbA mRNA level is not affected in the mutants are shown in SI Appendix, Fig. S3. (C) Ribo-seq analysis of Zm-hcf136 and At-hcf136 mutants. The midday data were published previously (33) and are shown here again in the context of the complete experiment. The Zm-hcf136 experiment was performed with two replicates. The IGV images are from maize data. IGV captures of replicates and data showing that psbA mRNA level is not affected in the mutants are shown in SI Appendix, Fig. S4.

