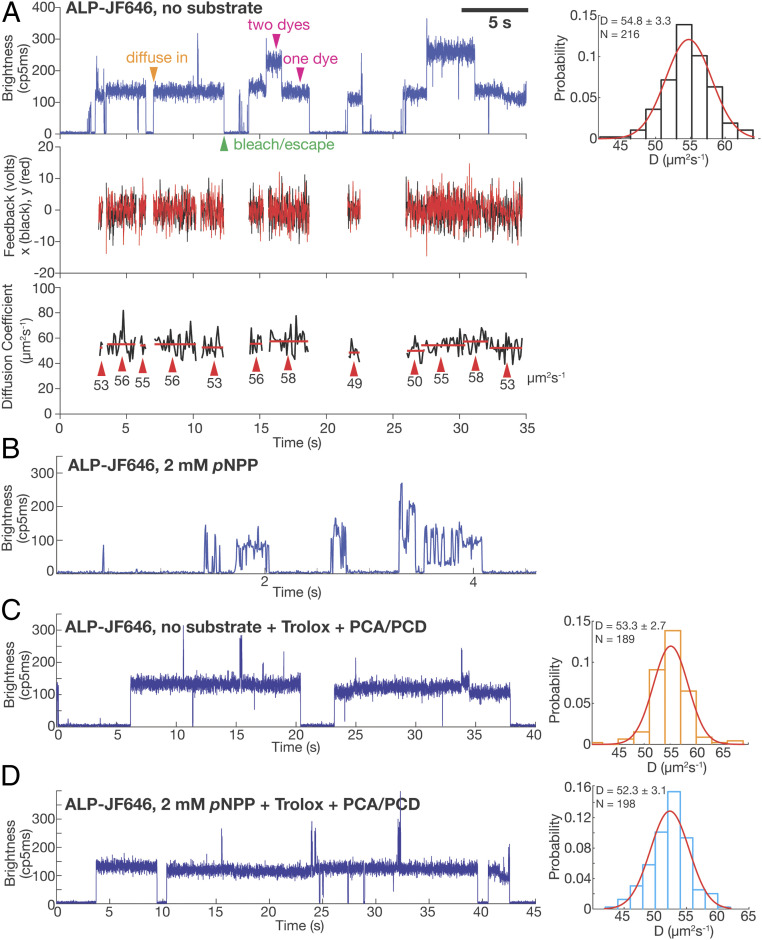
Fig. 3.
ABEL trap-based single-molecule diffusometry reveals no catalysis-induced diffusion enhancement of ALP. (A) A representative ABEL trap trace of ALP-JF646 with no substrate. (Top Left) Brightness plot (fluorescence intensity, photon counts per 5 ms) of the detected fluorescence signal. A single fluorophore corresponds to a brightness level of ∼130 (counts per 5 ms), whereas dual-fluorophore corresponds to ∼260 (counts per 5 ms). Transient spikes in the brightness trace are caused by brief co-occupancy of two molecules in the trapping region. The orange arrowhead (diffuse in) denotes the start of a successful trapping event. Magenta arrowheads denote the regions of the data that correspond to one or two dyes per protein molecule. The green arrowhead denotes the end of a trapping event, due to either photobleaching of the dye or escape of the trapped molecule. (Middle) The corresponding feedback voltages (x in black, y in red) applied in order to counteract Brownian motion and keep the molecule in trap. The feedback is only plotted when there is a molecule in the trap. (Bottom) D of each trapped molecule calculated every 100 ms (black trace). The red lines indicate the mean of each identified molecule (see SI Appendix for details of molecule identification procedure), with the value written under the red lines and denoted with red arrows. The mean D of each molecule is used to build up the histogram on the Top Right. (Top Right) D histogram of ALP-JF646 without substrate and a Gaussian fit to the data. Mean ± Std of D and number of single molecules trapped (N) are displayed on the top left corner. (B) A representative ABEL trap intensity trace of ALP-JF646 with 2mM pNPP. (C) A representative ABEL trap intensity trace (Left) and D histogram (Right) of ALP-JF646 with no substrate in the Trolox + PCA/PCD buffer. (D) A representative ABEL trap intensity trace (Left) and D histogram (Right) of ALP-JF646 with 2 mM pNPP in the Trolox + PCA/PCD buffer.

