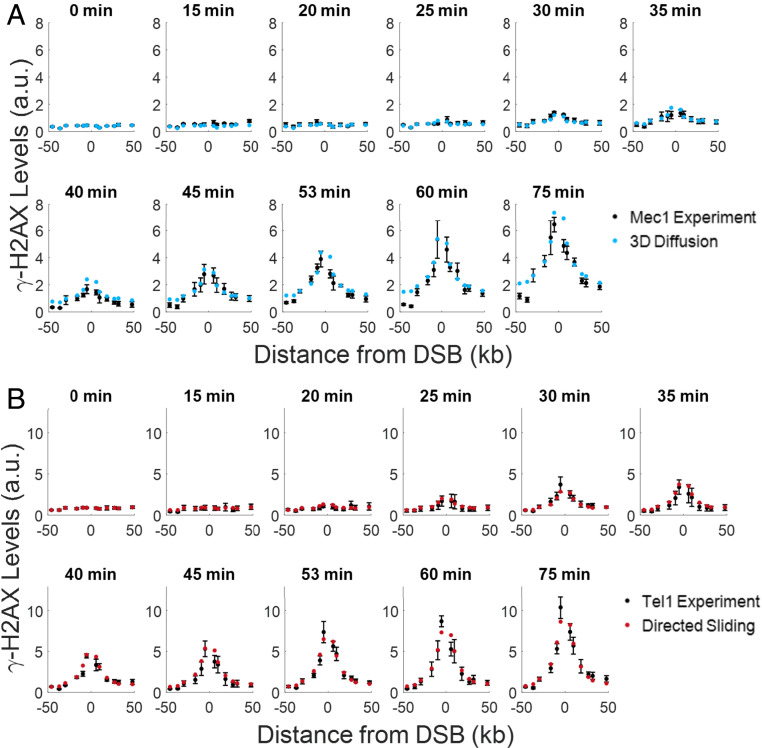
Fig. 4.
Comparison of experimental γ-H2AX profiles to the most likely theoretical spreading distributions. Comparison of experimental γ-H2AX profiles (black) to theoretical γ-H2AX distributions for the best model. (A) Experimental and theoretical curves for 3D diffusion (blue) by Mec1 phosphorylation. (B) Experimental and theoretical curves for directed sliding (red) by Tel1. The experimental error bars represent the SEM from n ≥ 3 measurements. The theory curves are plotted using parameters values shown in Table 3. Due to concerns about the reduction in γ-H2AX signal from resection close to the DSB, the −1.6-kb and 2.1-kb data points were excluded when performing fits to the experimental data. For the plots in A and B, our theoretical predictions start from the same background levels as in the experimental data.

