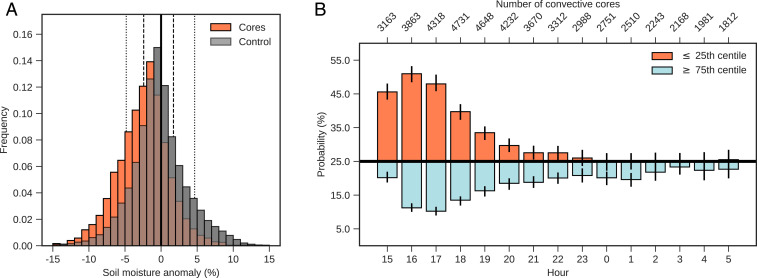
Fig. 2.
Fraction of convective cores affected by soil moisture conditions. (A) Frequency distribution (bars) of soil moisture anomalies (%) at storm time 1700 UTC sampled 150 km upstream of convective core location (orange), for a control sample across the region (gray), and their overlap (brown). Orange (gray) indicates enhanced (suppressed) core probability. Dotted (dashed) vertical lines depict the first and the last decile (quartile). (B) Probability for soil moisture anomalies associated with convective cores the 25th centile (orange) and the 75th centile of the respective hourly control distribution for 1500 to 0500 UTC. Black horizontal line indicates the 25% expected baseline, and vertical lines denote the 95% confidence interval of a bootstrap with 1,000 samples.

